
In Buncombe County, NC, Billions of Dollars of Home Value Go Untaxed

In another time, county commissioners in Western North Carolina charged with weeding out the truth from the noise in complaints about property tax assessments could have chosen to throw up their hands and say, “The devil’s in the details.”
But ignoring fundamental assessment issues raised by the community’s taxpayers meant missing the opportunity to add an additional $1–3 billion of taxable property value each year.
So, to their credit, commissioners instead seated an ad hoc committee that included members of the county board of equalization, community members, the real estate industry, and others to get to the bottom of why some people appeared to be paying more than they needed to, while others seemed to get tax breaks.
Ultimately, a working group of consultants and study partners helped the committee exorcise a demon of incomplete data lurking in the methodology for appraisals in Buncombe County. The advisers found owners of higher-valued properties were more likely to receive a tax break—not because they exercised some kind of unfair power over the process, but simply because of bad data.

What Bad Data?
In 2021, Buncombe County, North Carolina, completed its quadrennial, county-wide property value reassessment. This undertaking assigned new taxable values to all 130,000+ properties in the County based on current market trends. In North Carolina, a property’s assessed value should be equivalent to 100% market value—in other words, property owners should be paying taxes on the full value that the property could fetch if sold on the open market.
In 2021, there was over $48 billion dollars of total taxable property in Buncombe County, providing the basis for the collection of over $230 million dollars in County property taxes that year. This represents nearly two-thirds of Buncombe County’s general fund revenue. (By comparison, the ride-sharing company Uber is currently valued less than Buncombe County, at $41 billion dollars.)

In order for the County assessor to assign an assessed value to a property, they must know about important, value-related characteristics of the property. For a residential property, the assessor must know the number of bedrooms, bathrooms, garages, square footage of finished living space, etc., in order to develop an accurate estimate of market value.
A big challenge for most assessors however, is that they rarely, if ever, inspect the inside of properties during the reassessment process. They instead rely heavily on three channels of information to keep their property characteristic database up-to-date and accurate: (1) permits for new construction and renovations, (2) real estate records produced during the sale of a property, and (3) self-reported data from property owners.
Property owners intuitively compare what they paid for a property to what the assessor assigns as its taxable value. This straightforward comparison is actually one approach that assessors use to measure the performance of the valuation computer model. This indicator is known as a sales ratio. A sales ratio simply divides the assessed value of a property by its selling price. If a property sells for close to its assessed value, then a sales ratio would be around 1:1, indicated with the value of 1.0 in the graphical displays below. A sales ratio helps answer the question, “How well does the valuation model produce assessed values close to market value?” A comprehensive sales ratio study can help answer questions about whether higher- or lower-valued properties are systematically under- or over-assessed.

Conceptual outcomes of a sales ratio study. A sales ratio study which demonstrates that lower-valued homes are over-assessed compared to higher-valued homes is an indication of property tax regressivity (right). Ideally, the valuation model would produce assessed values close to market value uniformly for all homes, regardless of total home value (center).
In Buncombe County, roughly 5% of the 92,000 plus residential properties sell each year. When a home sells, the assessor is able to compare its selling price to the assessed value, and calculate a sales ratio. Sales ratios can be calculated for each of the homes that sell each year.
Choosing a Performance Indicator That’s Just Correct Enough…
In 2021, the Buncombe County Board of County Commissioners established an Ad Hoc Reappraisal Committee composed of eight community members tasked with reviewing the local property assessment process from an equity perspective. (Sidebar: Burlington, Vermont, followed suit and established a similar committee, but with a far more expansive charge and supporting resolution.)
Early in the process, the Assessor’s Office commissioned the third-party economics firm Syneva Economics to conduct a multi-year sales ratio study for residential property and presented the findings to the Ad Hoc Committee. Syneva’s report showed lower-valued homes were assessed as close to market value as higher valued homes were.

Findings from sales ratio study conducted by a third-party economics firm, in collaboration with the Buncombe County Assessor’s Office. These findings were presented to the community as evidence of uniformity/equity in the assessment model’s performance.
Upon closer inspection, however, it was discovered that there were substantial (but also subtle) flaws in the approach used to calculate sales ratios, which severely limit the validity of this study. The sales ratios in the Syneva report had been calculated by comparing the selling price of homes to the assessed value the following calendar year.
It’s important to understand what happens to a home’s assessed value from one year to the next. For the vast majority of unsold homes (95%), the assessed value remains constant for the four years between reappraisals (unless there are permitted improvements or renovations).
However, for sold properties (5%), the assessor is provided access to additional real estate records associated with the transaction (i.e., multiple listing service, or MLS, documents) and is able to compare the value-related property characteristics as they appear in the valuation database to the MLS records. If missing or inaccurate property characteristic data are identified, the assessor makes the necessary corrections and produces a revised assessed value to be used for the following calendar year.
The assessor and the third-party economics firm used these revised assessed values to calculate sales ratios (see: “Sales Ratio Version 2” in the graph below). For example, instead of comparing a home’s 2018 sale price to its 2018 assessed value (the assessed value the year it sold), the ratio was calculated using the 2018 sale price and the 2019 assessed value—a value that had already been adjusted to account for missing or inaccurate property characteristic data found through the 2018 sale. This is problematic for several reasons.
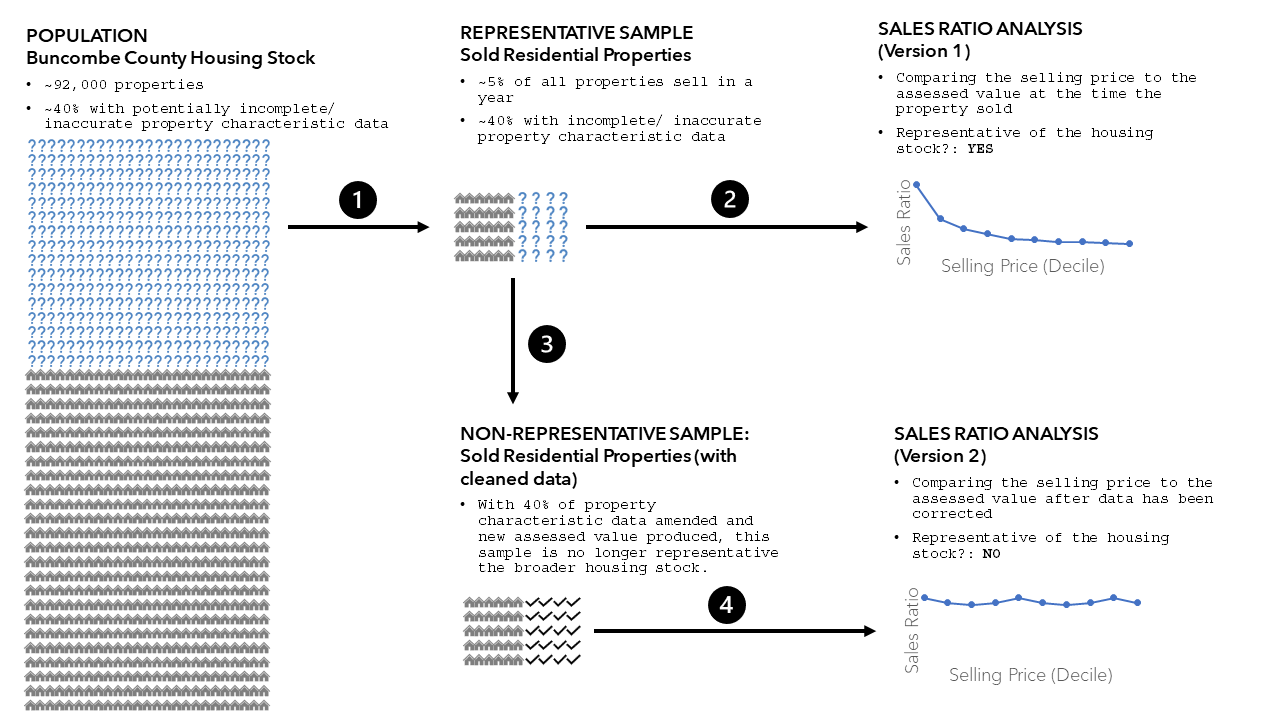
Schematic diagram of two approaches to evaluating the performance of the valuation model using sales ratios. Steps 1 and 2 produce evidence that is representative of the performance of the valuation model in the broader housing stock. Step 3 and 4 compromise the representativeness of the sample and cannot be used to draw conclusions about the housing stock.
…But Also Just Wrong Enough to Overlook Billions
First, this approach to performance evaluation does not conform to industry standards. The International Association of Assessing Officers (IAAO) adopted their most recent Standards on Ratio Studies nearly a decade ago. These standards unambiguously define the purpose and approach to sales ratio studies. The process of selectively updating property characteristics of sold properties (as described above), without updating the characteristics of unsold properties is referred to as “sales chasing” and is explicitly recognized as unsound practice.
Second, this approach to performance evaluation does not represent the vast majority of the housing stock. The IAAO’s standards emphasize the importance of ensuring that the sample of sold properties is representative of the broader housing stock. “Sales chasing,” as defined by the IAAO, increases the accuracy of property characteristics only for sold properties and therefore compromises the representativeness of the sample. Therefore, the findings from a ratio study in which sold property characteristics have been differentially updated are not representative of the 95% of unsold homes that do not have their characteristics updated (see above: “Sales Ratio Version 2”).
Third, this approach to performance evaluation overlooks the impact of incomplete or inaccurate property characteristic data. In 2021, roughly 40% of sold homes were identified to have missing or incomplete property characteristic data. In total, $96 million dollars of previously untaxed value was discovered from the less than 5% of homes that sold that year. If this rate of incomplete or inaccurate property characteristic data is present across the broader housing stock, there could be between $1 and $3 billion dollars of untaxed value missing from the county’s calculations.
There are two important trends to note when understanding the implications of incomplete property characteristic data. First, the likelihood of a property having inaccurate or incomplete data is higher among more expensive properties. Second, in general, incomplete or inaccurate data produces assessed values significantly lower than market value. Taken together, this means that owners of higher-valued properties are more likely to receive a tax break, simply because of bad data.

Finally, this approach to performance evaluation falsely claims equitable property assessment outcomes. You may recall that Buncombe County and the City of Asheville, North Carolina, became two of the first local governments to pass resolutions in favor of reparations for Black residents. The County also declared racism as a public health crisis and subsequently developed a racial equity action plan.
When sales ratio studies are conducted according to international standards of best practices—such as the national study conducted by Dr. Christopher Berry with the University of Chicago’s School for Municipal Finance—the patterns look a lot different. The findings demonstrate a clear pattern that lower-valued properties are systematically over-assessed compared to higher-valued properties. In other words, owners of lower-valued properties are paying a larger share in property taxes. In Buncombe County, owners of lower-valued properties tend to be low-income households and residents of color.

The outcomes of a sales ratio study in Buncombe County conducted by the University of Chicago’s School for Municipal Finance. The findings demonstrate a systematic over-assessment of lower-valued properties compared to higher-valued properties. Since this study was conducted according to standards of best practice, the findings can be interpreted to reflect the broader housing stock. (Reprinted with permission from the author.)
When Buncombe County presented their sales ratio study to the Ad Hoc Reappraisal Committee, they introduced a performance metric that threatened to make the Committee’s already difficult undertaking nearly impossible. After all, you can’t improve what you don’t measure. Interrogation of the County’s methods revealed that their sales ratio calculations not only overlooked billions of dollars of untaxed property value, but perhaps more damaging, obscured tax assessment inequity. If the County is truly committed to reparations for its Black residents, metrics used in the tax assessment process should be rigorously interrogated, tested, and fine tuned until they reflect the realities of the entire housing stock.

Ori Baber is an analyst with Urban3 and project lead for Just Accounting in Western North Carolina. Ori earned his doctorate in sustainable infrastructure and urban health from the University of Florida. As a data scientist and urbanist, Ori leverages his expertise to identify scalable planning practices that produce better health outcomes and vibrant economies.

Lanier Hagerty is an analyst with Urban3. She holds a master's degree in urban planning from Columbia University where she studied urban data analytics and international planning. Lanier's interests include land use, land valuation, and the politics of land tenure.