
The Solvent City: What Does It Look Like?
After joining the Strong Towns movement, my first thought as a planner was, how do I translate Strong Towns principles and tools into workable formulas for my town, Gallatin, Tennessee? I could talk about things like the Growth Ponzi Scheme, but I knew that without some hard, localized data to back it up, people probably wouldn’t take the message seriously.
My last article for Strong Towns took Chuck’s Analyzing the Cul-de-Sac article and applied it to twelve cul-de-sacs in my town. Predictably, I found that none of them generated enough tax revenue to pay for their own maintenance and replacement. In this article I’d like to take a more macro view, but using the same ideas and data for the most part—and coming to the same conclusions, as I’m sure you’re expecting.
I’m going to approach the problem from two angles. The first question I want to answer is this: For my town, what is the “zone of solvency”? By that I mean, with the amount we budget each year for roadway repair and reconstruction, what is the size of town we can reliably take care of? Gallatin is a town of 32.53 square miles. Are we budgeting enough money to repair and replace all of the roads within that land mass?
The second question is, what is the unit of development that our current level of funding allows us to support? Lot width is the key here. The wider the lots, the more road, curb, and sidewalk you need to access to them.
Zone of Solvency
How vast can your town be before it’s fiscally unsound? That’s what I’m trying to figure out for Gallatin with this method.
You’ve probably all seen a map like this before:
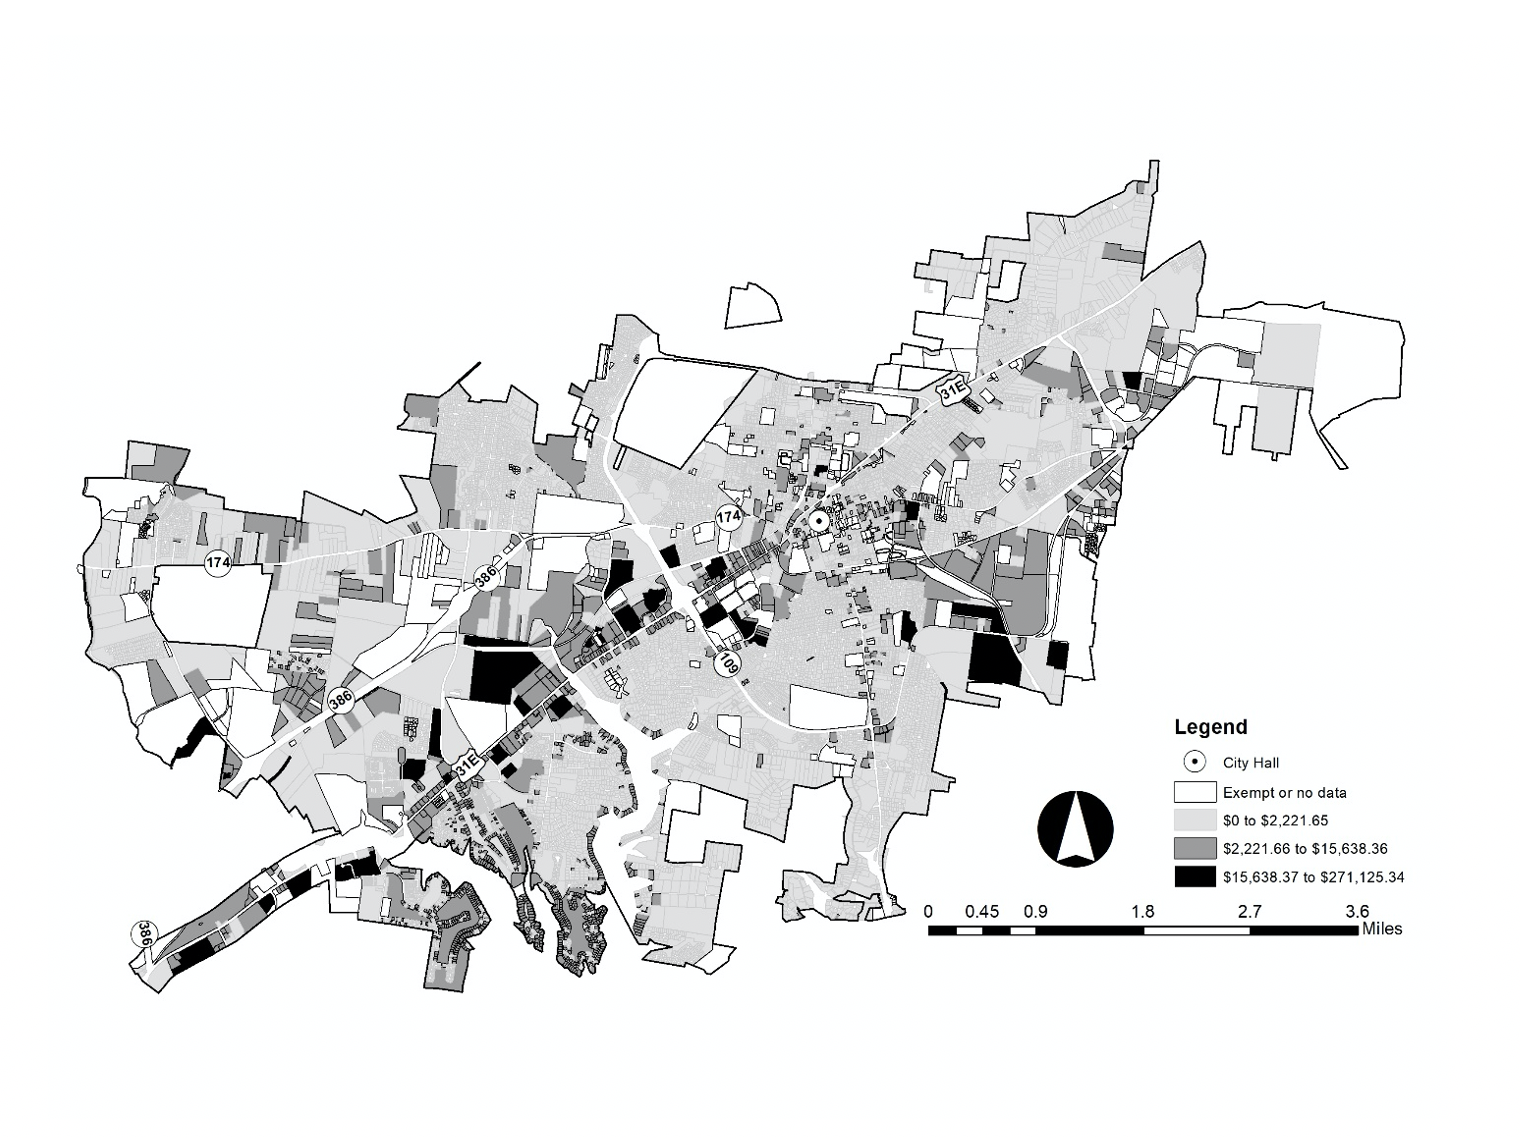
This is what I call “conventional knowledge.” It’s a parcel map of Gallatin that shows raw revenue per parcel (very different from the Strong Towns “value per acre” map). This map shows what you might expect: commercial and industrial properties are high producers, as are affluent suburban developments on the outskirts and lakefront millennium mansion homes in the southwest.
Using Strong Towns logic, however, we can produce a map that reveals the true cost of a development pattern like this. And the high and low producers, at least on the residential side, will be flipped.
Understanding the cost of transportation infrastructure requires some pretty intense data. Buck Dwyer, PE, at my city’s Engineering Division, came up with the following:

How do these price tags translate into maintenance bills? If we estimate roadway lifespan at about 14 years, we can find the amortized yearly cost as shown in the next table. With this number for each roadway class, multiplied by the total mileage per class, we can come up with the yearly maintenance bill.

Next question is, how do we allocate this bill so as to reflect the hidden cost of the suburban development pattern? For that, there’s a handy extension within ArcMap called Network Analyst. Using the Closest Facility Tool, we can map out the route of every parcel within the city to City Hall, in the center. We’ll use distance from City Hall as a proxy for horizontal expansion.
To get the weighted share of the total maintenance bill for each parcel, we’ll use the distance values for all the parcels that were generated by Network Analyst, add them up, and plug them into this equation:

The cumulative distance of all parcels from City Hall in Gallatin is 46,948.38 miles, and the total yearly maintenance bill is $2,773,506.95. Solving for a gives the weighting factor, which when multiplied by a parcel’s distance number, gives that parcel’s weighted share of the total road maintenance bill.
Predictably, mapping these weighted shares shows lower access costs clustering around the core and inner-ring neighborhoods and rising as distance from City Hall increases.

So this is how much it’s costing. How does that compare to how much we’re spending? Well, the City of Gallatin spends only $0.0224 of every dollar of tax revenue on roadway repair. Multiplying each revenue per parcel amount by 2.24% gives how much of that revenue is being spent on roadway repair and reconstruction. (Note: You’ll have to contact some people at your city and figure out what the percentage is where you live. It’s probably something small like this.) If we subtract the access costs from this reduced portion of total revenue earmarked for roads and map the resulting figures, a pattern will emerge. In Gallatin’s case, the pattern is that outside of a roughly 0.5-mile radius around City Hall, most parcels are fiscally in the red, except for commercial and industrial properties.

Looks like only the core and select commercial and industrial corridor properties are solvent! I’m going to zoom in to the downtown area on the next map, and then show you a map from 1870 that reveals a shocking parallel.


Source: Library of Congress
As you can see, the “zone of solvency” in Gallatin, based on the 2.24% of the budget being spent on roadway repair and reconstruction each year ($888,000), is roughly no larger than the size of the city in 1870! As stated, certain commercial and industrial properties along corridors do seem to produce enough tax revenue to pay for their access costs. But in general, we’re funding roadway reconstruction in Gallatin as if we were still a half-square mile nineteenth-century walking city rather than the 32-square mile sprawling suburban juggernaut we’ve become!
Unit of Solvency
Separate but related is the second method I want to employ.
“We’re funding roadway reconstruction in Gallatin as if we were still a half-square mile nineteenth-century walking city rather than the 32-square mile sprawling suburban juggernaut we’ve become.”
With this method, I was thinking more about what the unit of solvent development in Gallatin looks like. Though the idea of infrastructure “paying for itself” is extremely complex and invites all kinds of qualifications, it would still seem useful to figure out what our baseline is, just in case we did want our infrastructure to pay for itself (crazy concept, right?).
What does it cost to provide access to a lot? We could say it requires at the very least the infrastructure lying right in front of it. My previous research revealed that, for Gallatin, the city is paying for road, curb/curb and gutter, and sidewalk with general fund money. Our city-owned utility companies fund their own infrastructure maintenance and provision when it comes to water, sewer, gas, and electric through user fees, and we have a stormwater utility fee that seems to take care of our stormwater pipes, headwalls, and drainage ways. So I’m going to narrow my focus to the aforementioned above-ground pieces of common infrastructure.
For this scenario, we’ll estimate per parcel revenue contribution based on how many parcels the city is responsible for providing access to. That means getting the total parcel number and then subtracting out all those parcels that are accessed via state-owned roads, which the city isn’t responsible for. This leaves 14,474 parcels out of 15,610. Then we split the annual road repair and reconstruction budget ($888,000) between them. This gives us a per parcel share of $61.35. This is how much each parcel needs to contribute to the repair budget to reach our current level of funding.
Next we’ll figure out how much those pieces of infrastructure I mentioned above cost. For a road, one mile costs $107,960. One mile is 5,280 feet, so the cost per foot is $20.45. However, that's for two sides of the road. One mile of half a road costs $53,980, making the cost per foot $10.22. For sidewalk, each foot costs $37.50. For curb and gutter, each foot costs $25.20.
If the road is replaced every 14 years, the $10.22 becomes an annual $0.73. If the sidewalk is replaced every 30 years, the $37.50 becomes $1.25. If the curb and gutter is replaced every 30 years, the $25.20 becomes $0.84. Adding up the per foot price of all three components together comes to $2.82 per foot annually for a local street with asphalt pavement, curb and gutter, and sidewalk.
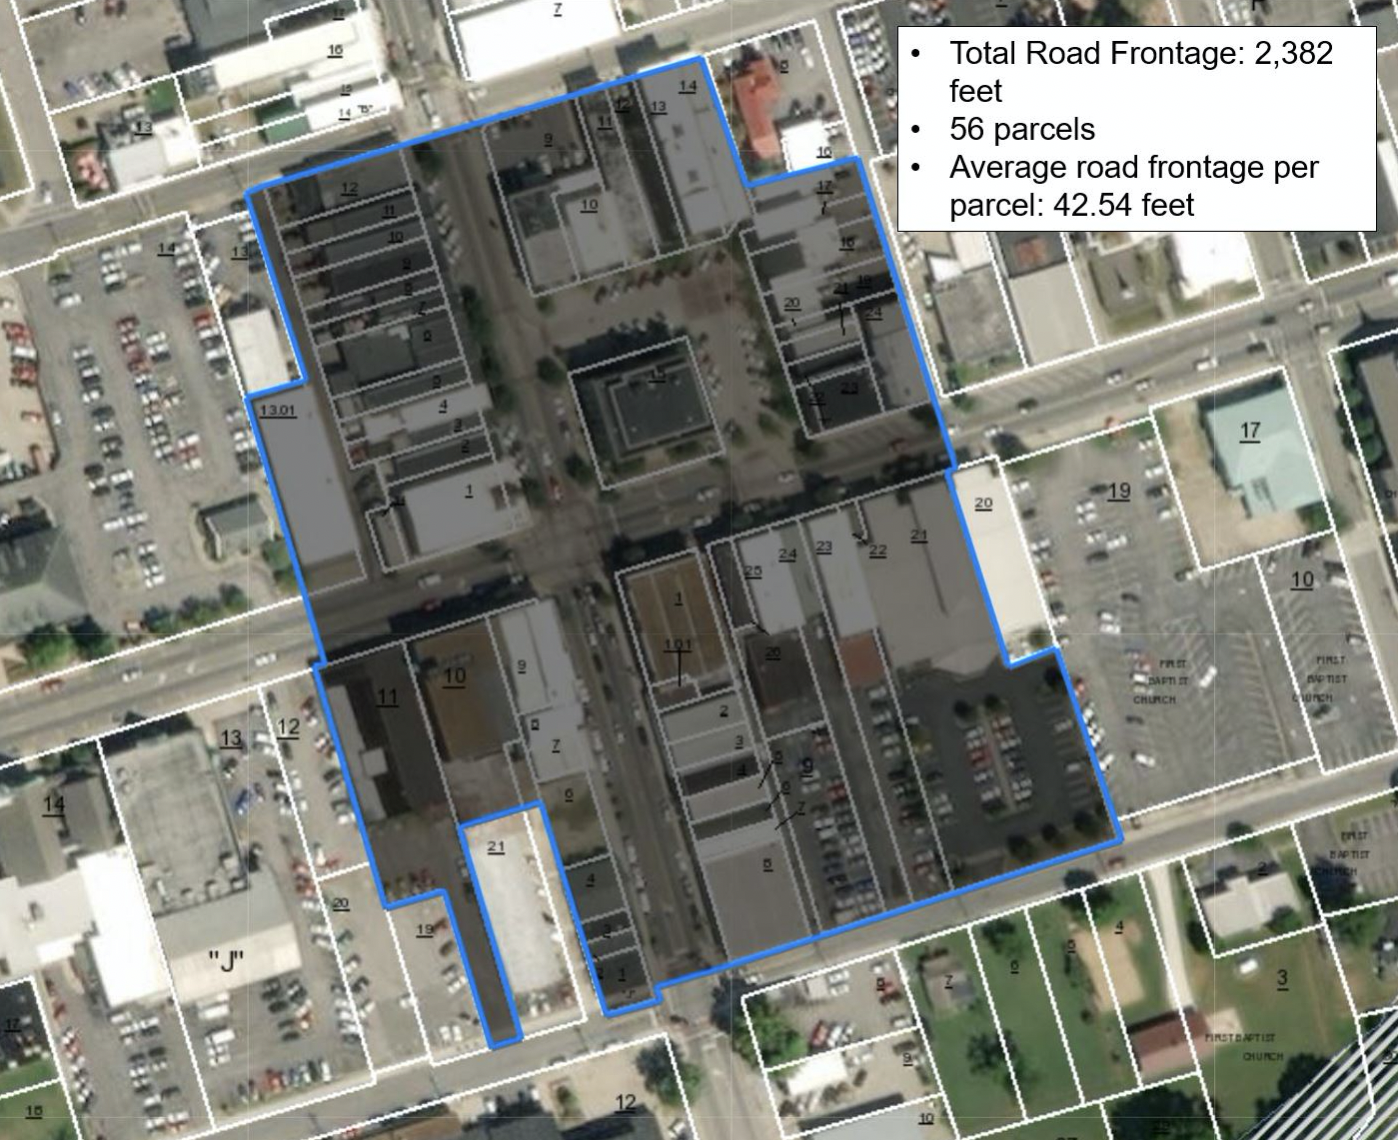
If each parcel pays $61.35 per year, and a foot of frontage on a public road costs $2.82, then each parcel is paying for the equivalent of 21.76 feet of road frontage. In other words, any parcel with a lot width wider than 21.76 feet is costing the city more in maintenance obligations than it is generating in tax revenue, under the current taxation levels.
That’s basically the width of a townhome, or a downtown commercial lot. And those type of properties by no means make up the majority of our stock. Clearly, there’s a major deficit somewhere.

Check this out: even in the densest part of town, average parcel width is still greater than 21.76 feet:
Relating the two methods
The two methods overlap and differ in important ways, but they reveal the same picture: we have overextended ourselves in the area of infrastructure provision, and our level of funding isn’t enough for even the densest of development patterns.
How can this be? How are the roadways even still functioning if this is how little we’re routinely budgeting to fix them? My hypothesis is that it comes down to three factors.
The roadway building boom is still relatively young in Gallatin, so many of Gallatin’s roads have not yet required major reconstruction.
Roadway life expectancy can be extended through good routine maintenance, and therefore reconstruction can be deferred past the standard 14-year deadline cited in this article.
One-time spending packages based on large, random infusions of tax dollars are probably being used at various times to fund projects.
This last factor is the key to the Growth Ponzi Scheme, and the reason why a budgetary setup like this requires infinite growth. (Un)luckily, there doesn’t seem to be any end in sight to the explosive growth in Gallatin and the Middle Tennessee region. But that day will come. In the meantime, can we turn this ship around?
Note: This article is based on a paper accepted for publication in the Journal of Architectural and Planning Research.
Acknowledgements
The author thanks Rachel Nichols of the Gallatin Finance Department; Dewayne “Buck” Rogers, PE, and Nick Tuttle, PE, of the Gallatin Engineering Division; William McCord, AICP, of the Gallatin Planning Department; Zach Wilkinson, PE, RLS, of the Gallatin Public Works Department; and Jesse Mardis and Preston Dallas of the Gallatin IT Department for their generous help with this article.
About the Author

Dustin Shane, AICP, is an urban planner interested in exploring the intersection of philosophy, culture, and city building. He blogs about these and other topics at placeandtheory.com. He and his wife Maude are natives of Nashville and Middle Tennessee and enjoy fishing, local history, house spotting, and cooking.