I Did the Math on My Town’s Cul-de-Sacs. Here's What I Found.

%20(1).avif)
%20(1).avif)
%20(2).avif)
%20(1).avif)
Since reading Chuck Marohn’s Strong Towns book, I’ve been interested in figuring out if the way we’re building my town—Gallatin, Tennessee, where I work as an urban planner—is financially sustainable. My suspicion, after reading the book, browsing many of the online articles, joining the movement, and even meeting Chuck at the Power of Ten local government conference in Nashville last fall, was that we are not, but I wanted to find something concrete to demonstrate that.
The core insight (that “light bulb” moment) of Strong Towns for me was that low density suburban living requires more roads, curbs, sidewalks, and pipes than it pays for in tax revenue—meaning, it’s not solvent. It will ultimately bankrupt us. As a planner, the “badness” of sprawl was drilled into me from day one in planning school, but since that’s the majority of the development that’s still getting built these days (in smaller cities like my own, at least), I almost began to think that planners and other New Urbanist, Smart Growth, or anti-sprawl types were basically trying to convince everyone else of a position that boiled down to little more than subjective preference (or environmentalism, but that’s something people will debate as well).
What was amazing about Strong Towns was that it validated this pro-traditional, walkable town development philosophy with hard data based on dollars-and-cents: and that’s something no one can argue with (if they’ll give you a hearing). Arguing with a developer in front of a Planning Commission about density and walkability is a lot easier when my argument is, “Hey, this development is going to create too many unfunded maintenance obligations going forward,” instead of, “Hey, this development just doesn’t give me warm fuzzies.” That’s not a hit against aesthetics and intuition in planning—just an acknowledgment that money talks much louder than anything else in this society.
Doing the Math: Finding and Running the Numbers
After mulling over our situation here in Gallatin, I decided to focus on the cul-de-sac. Why? Well, as a city that didn’t start growing in earnest until the automobile age, we have plenty of them. And second, I’d read Chuck’s seminal article about the cul-de-sac. It made perfect sense. If a cul-de-sac is stripped to its essentials and brought to the bar of the balance sheet, it has nowhere to escape. It can’t offer the excuse, like most of our wide, low-density commercial roads, that it provides network effects beyond its immediate vicinity. It exists for one purpose and one purpose only: to provide access to the homes built around it. That’s why Chuck identified it as the perfect candidate for a fiscal “interrogation” and why I’m following in his footsteps.
To this end I took twelve basically random cul-de-sacs in Gallatin and tried to line out and price all the infrastructure they contained. I figured out how much each household was paying, on average, towards each infrastructure type price tag. And then I subtracted the infrastructure replacement costs (amortized over the life expectancies of each piece of infrastructure) from the revenue totals and found out whether they were paying for themselves or not.
For the traditional utilities (water, sewer, and electric), the rate structures were available online. I used average consumption per household for these resources and so was able to calculate how much the average household is paying per year. For stormwater, most households pay about $5 per month toward the Stormwater Utility Fee.
"If a cul-de-sac is stripped to its essentials and brought to the bar of the balance sheet, it has nowhere to escape....It exists for one purpose and one purpose only: to provide access to the homes built around it."
For roads, I had to do a bit more digging. It turns out our Public Works Department spends about $88,000 per year on minor repairs and our Engineering Division spends about $800,000 per year on major reconstruction of existing roads (usually bid out to a contractor). New roads are separate from these totals and are financed in various ways as capital expenditure projects. So, for my purposes, $888,000 was the magic number. This amounted to only 2.24% of the 2018 budget, and when divided out, came to $53.17 per year per household. This number was far less than the average annual amounts being paid by households for utility services—$1,512.60 for electricity, $404 for water, $404 for sewer, $472.20 for gas, and less than even the $60 for stormwater.
I took these numbers and multiplied them by the number of households on a given cul-de-sac. Then I took the inventory infrastructure I performed (by visual survey and by an inspection of final plats and master plan documents) for that cul-de-sac and subtracted the amortized annual costs from the revenue numbers. Each piece of infrastructure had a different life expectancy, so the total costs on each street had to be divided up in various ways; e.g., roads are assumed to have an average lifespan of 14 years according to our local Engineering Division, while an extruded curb can reasonably be expected to last 20 years (according to a source I found online, which is cited in the table).
Doing the Math: What the Numbers Reveal
The spreadsheet at the end of this article (and excerpted below) is the result of all this number crunching, and it’s sourced. It reveals two major things: one, our utility companies (Gallatin Public Utilities and Gallatin Department of Electricity) seem to collect enough with their rate structures to pay for the infrastructure they’ve built (water lines, sewer lines, manholes, poles, light fixtures, underground conduit, and electric line). I can’t say that for sure—all I can say is that they’re taking in more than they’re expending, at least for their street-level infrastructure. I also found that the stormwater infrastructure (pipes, inlets, and headwalls) in every case but one can be covered by the stormwater utility fees that the City collects now—and some places have very little stormwater infrastructure, so that money can go toward fixing other more complex configurations elsewhere. I didn’t account for every little nut and bolt, so it can be assumed my totals are a little low, but in general the revenue cushion was substantial enough.
However, when it comes to roads, not one of the cul-de-sacs is in the black.
On the spreadsheet you can see in detail each piece of infrastructure I isolated and priced out, and my count for each cul-de-sac. Take Lilycrest Drive, for instance.
- A quarter mile of asphalt road, priced at $107,960 per mile, needing replacement every 14 years, comes to a total cost of $26,990 and a yearly cost of $1,927.86.
- Next, 2,693 feet of sidewalks at $37.50 a foot comes to a total cost of $100,987.50, and if replacement occurs every 25 years (maybe it doesn’t, but that’s supposedly the standard), the yearly cost is $4,039.50.
- After that is the cost of the extruded curb: $12.86 per foot for the straight portion and $22.59 per foot for the curved portion (replaced every 20 years). The curb portions come to $23,767.50 ($1,188.7 yearly) and $17,894.45 ($894.72 yearly), respectively.
- The road, sidewalk, and curb together come to a total cost of $169,639.45 and an annual cost of $8,050.45.
Now, if the 31 homes on Lilycrest all pay their portion of the total I mentioned above for road reconstruction, $53.17 each, it becomes immediately clear that this amount ($1,648.27) does not even pay for the asphalt, sidewalks, and curbs of Lilycrest, much less any of the roadway these homes are dependent on to connect Lilycrest with other parts of the city. If these homes at least broke even and Lilycrest was covered, we could then perhaps remain agnostic about whether this suburban development pattern is sustainable. (I would maintain it’s not because how far Lilycrest is from everything else builds in hidden costs to its true infrastructure balance sheet.) But, as it is, Lilycrest is going to require an infusion of tax dollars from somewhere else to ultimately continue to do what it was built to do.
What about the budget? Why aren’t we in more pain if the amount we spend on these roads is woefully inadequate to pay for their eventual and impending replacement? Chuck says cities like us that are growing (take a look at the news—the Nashville metro area, of which we’re a part, is growing like a weed) can effectively mask the financial strain of aging infrastructure by getting large infusions of new infrastructure. In effect, the tax revenue generated by new, developer-built infrastructure pays for the reconstruction of aging infrastructure. This works for as long as growth keeps going. But one day it will stop, and we’ll wish then that our streets and infrastructure were self-sustaining. Suburbia is not. It must be propped up by federal subsidies.
Cities that are growing] can effectively mask the financial strain of aging infrastructure...by getting large infusions of new infrastructure...This works for as long as growth keeps going. But one day it will stop.
What Would Make Us Fiscally Solvent?
What would make it fiscally solvent? I guess there are two options: raise the taxes or increase the density.
Raising taxes would entail at least a couple hundred dollars extra per year for each household (for Lilycrest each household would have to pay $206.52 more a year just to break even). And of course, that might still not be enough—we’d really need an accurate accounting of the entire city to say for sure how much the taxes needed to go up.
The other option is increasing density. However, we’re talking about a lot more density in these places. Take a look at the dwelling unit per acre numbers I’ve crunched that reveal just how dense each of these streets would have to be to pay for itself at the current tax rate.
Each table below shows how many dwelling units per acre (DU/Ac), the average lot width (Avg. Lot width) that each street contains, and, to the right of that, its road maintenance revenue balance. The first table is the existing conditions. Notice that DU/Ac ranges from 2.37 to 3.72 and average lot width ranges from 48.74 to 88. Now look at the DU/Ac and average lot width columns in the second table. These have been adjusted to make all the balances positive. You can see that some cul-de-sacs will require densities of as much as 16.29 dwelling units an acre to break even (Lilycrest is the biggest one). If we rule out multi-family type developments and confine ourselves to townhome-style development, lot widths would have to be as narrow as 14.4 feet on Foxland Boulevard. That’s very urban. For reference, here is a picture of a 12-foot-wide townhome:
Fiscally solvent densities at current tax levels:

Existing densities and deficits:

The streets that are able to maintain their lower DU/Ac and lot width numbers (Jean, Ross, Creekside Court) are streets with no curbs or sidewalks. From my analysis, it seems like the development pattern we’ve historically favored in Gallatin (roughly 3 dwelling units per acre, with 70 to 80-foot-wide lots) is only solvent (but just barely so) when there is a simple asphalt road with no curbs or sidewalks.
For roads like Lilycrest, which have sidewalks and curbs, or Foxland Boulevard, with sidewalks and curb and gutter, the density per acre has to be much greater and the width of each lot at the street has to be much smaller.
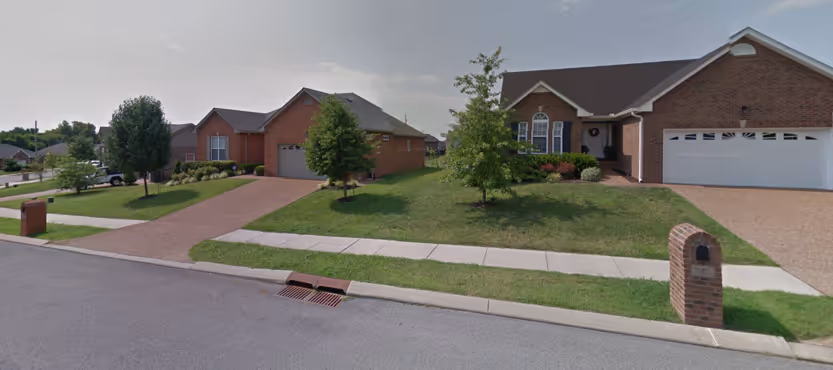
Here are some reference pictures to help visualize the changes I’m talking about. This is Lilycrest’s pattern of development now (3.32 +/- dwelling units per acre, 82.50 +/- foot average lot width):

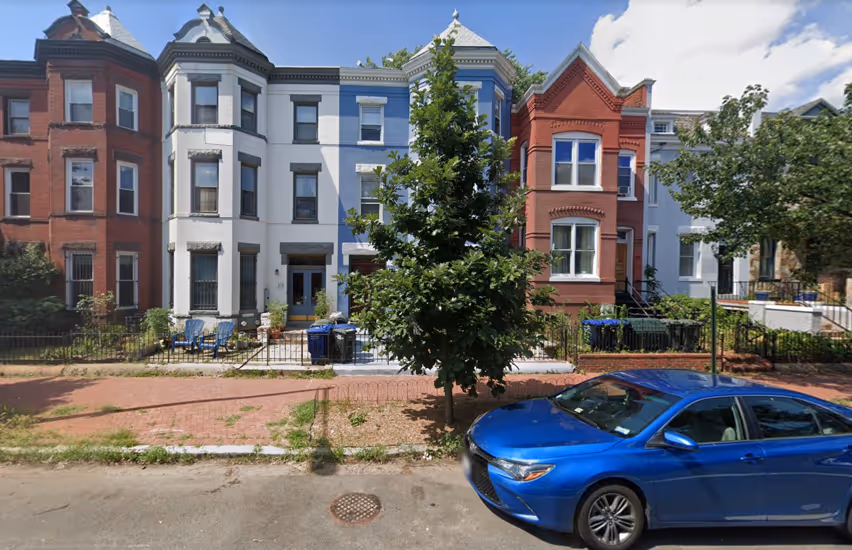
In order to be fiscally solvent—for the tax revenue it generates under the current tax regime to pay for the infrastructure it’s made up of right now—Lilycrest would have to have densities roughly comparable to this block on F Street in the Capitol Hill neighborhood of Washington, DC (14.63 +/- dwelling units per acre, 18 +/- foot average lot width):
Now while quite a few of the new master-planned developments we’re seeing have high-density townhome sections, that’s still quite a bit different than what most people in Gallatin are used to. Since there are a lot of people that will choose Lilycrest’s current form and who say they would never live in anything like the DC example, a possible short-term solution might be a suburb use tax: the less dense or farther out your subdivision is, the higher surcharge you pay on your property tax, based on a sliding scale. This would not be a penalty on suburban living per se but rather a plan to ensure that the people that get to enjoy the “benefits” of it should pay for it.
Ultimately, though, I think no amount of bandaging with higher tax rates or user fees is going to be a long-term solution. The Strong Towns message—that growth should be incremental and solvent—is gaining traction. We are in the midst of a comprehensive plan overhaul in Gallatin right now. The voices for compact growth, for less sprawl, for saving farmland, and for more walkable and mixed use developments are gaining ground. With any luck, we can use a Strong Towns-inspired analysis to back up these sentiments with hard-hitting fiscal facts.
[[divider]]
Note: The author wishes to thank Rachel Nichols of the Gallatin Finance Department; Dewayne “Buck” Rogers, PE, and Nick Tuttle, PE, of the Gallatin Engineering Division; William McCord, AICP, of the Gallatin Planning Department; and Zach Wilkinson, PE, RLS, of the Gallatin Public Works Department for their generous help in collecting and explaining much of the raw data in this article.
Spreadsheet: Download the author’s spreadsheet analyzing the 12 cul-de-sacs in Gallatin, Tennessee.
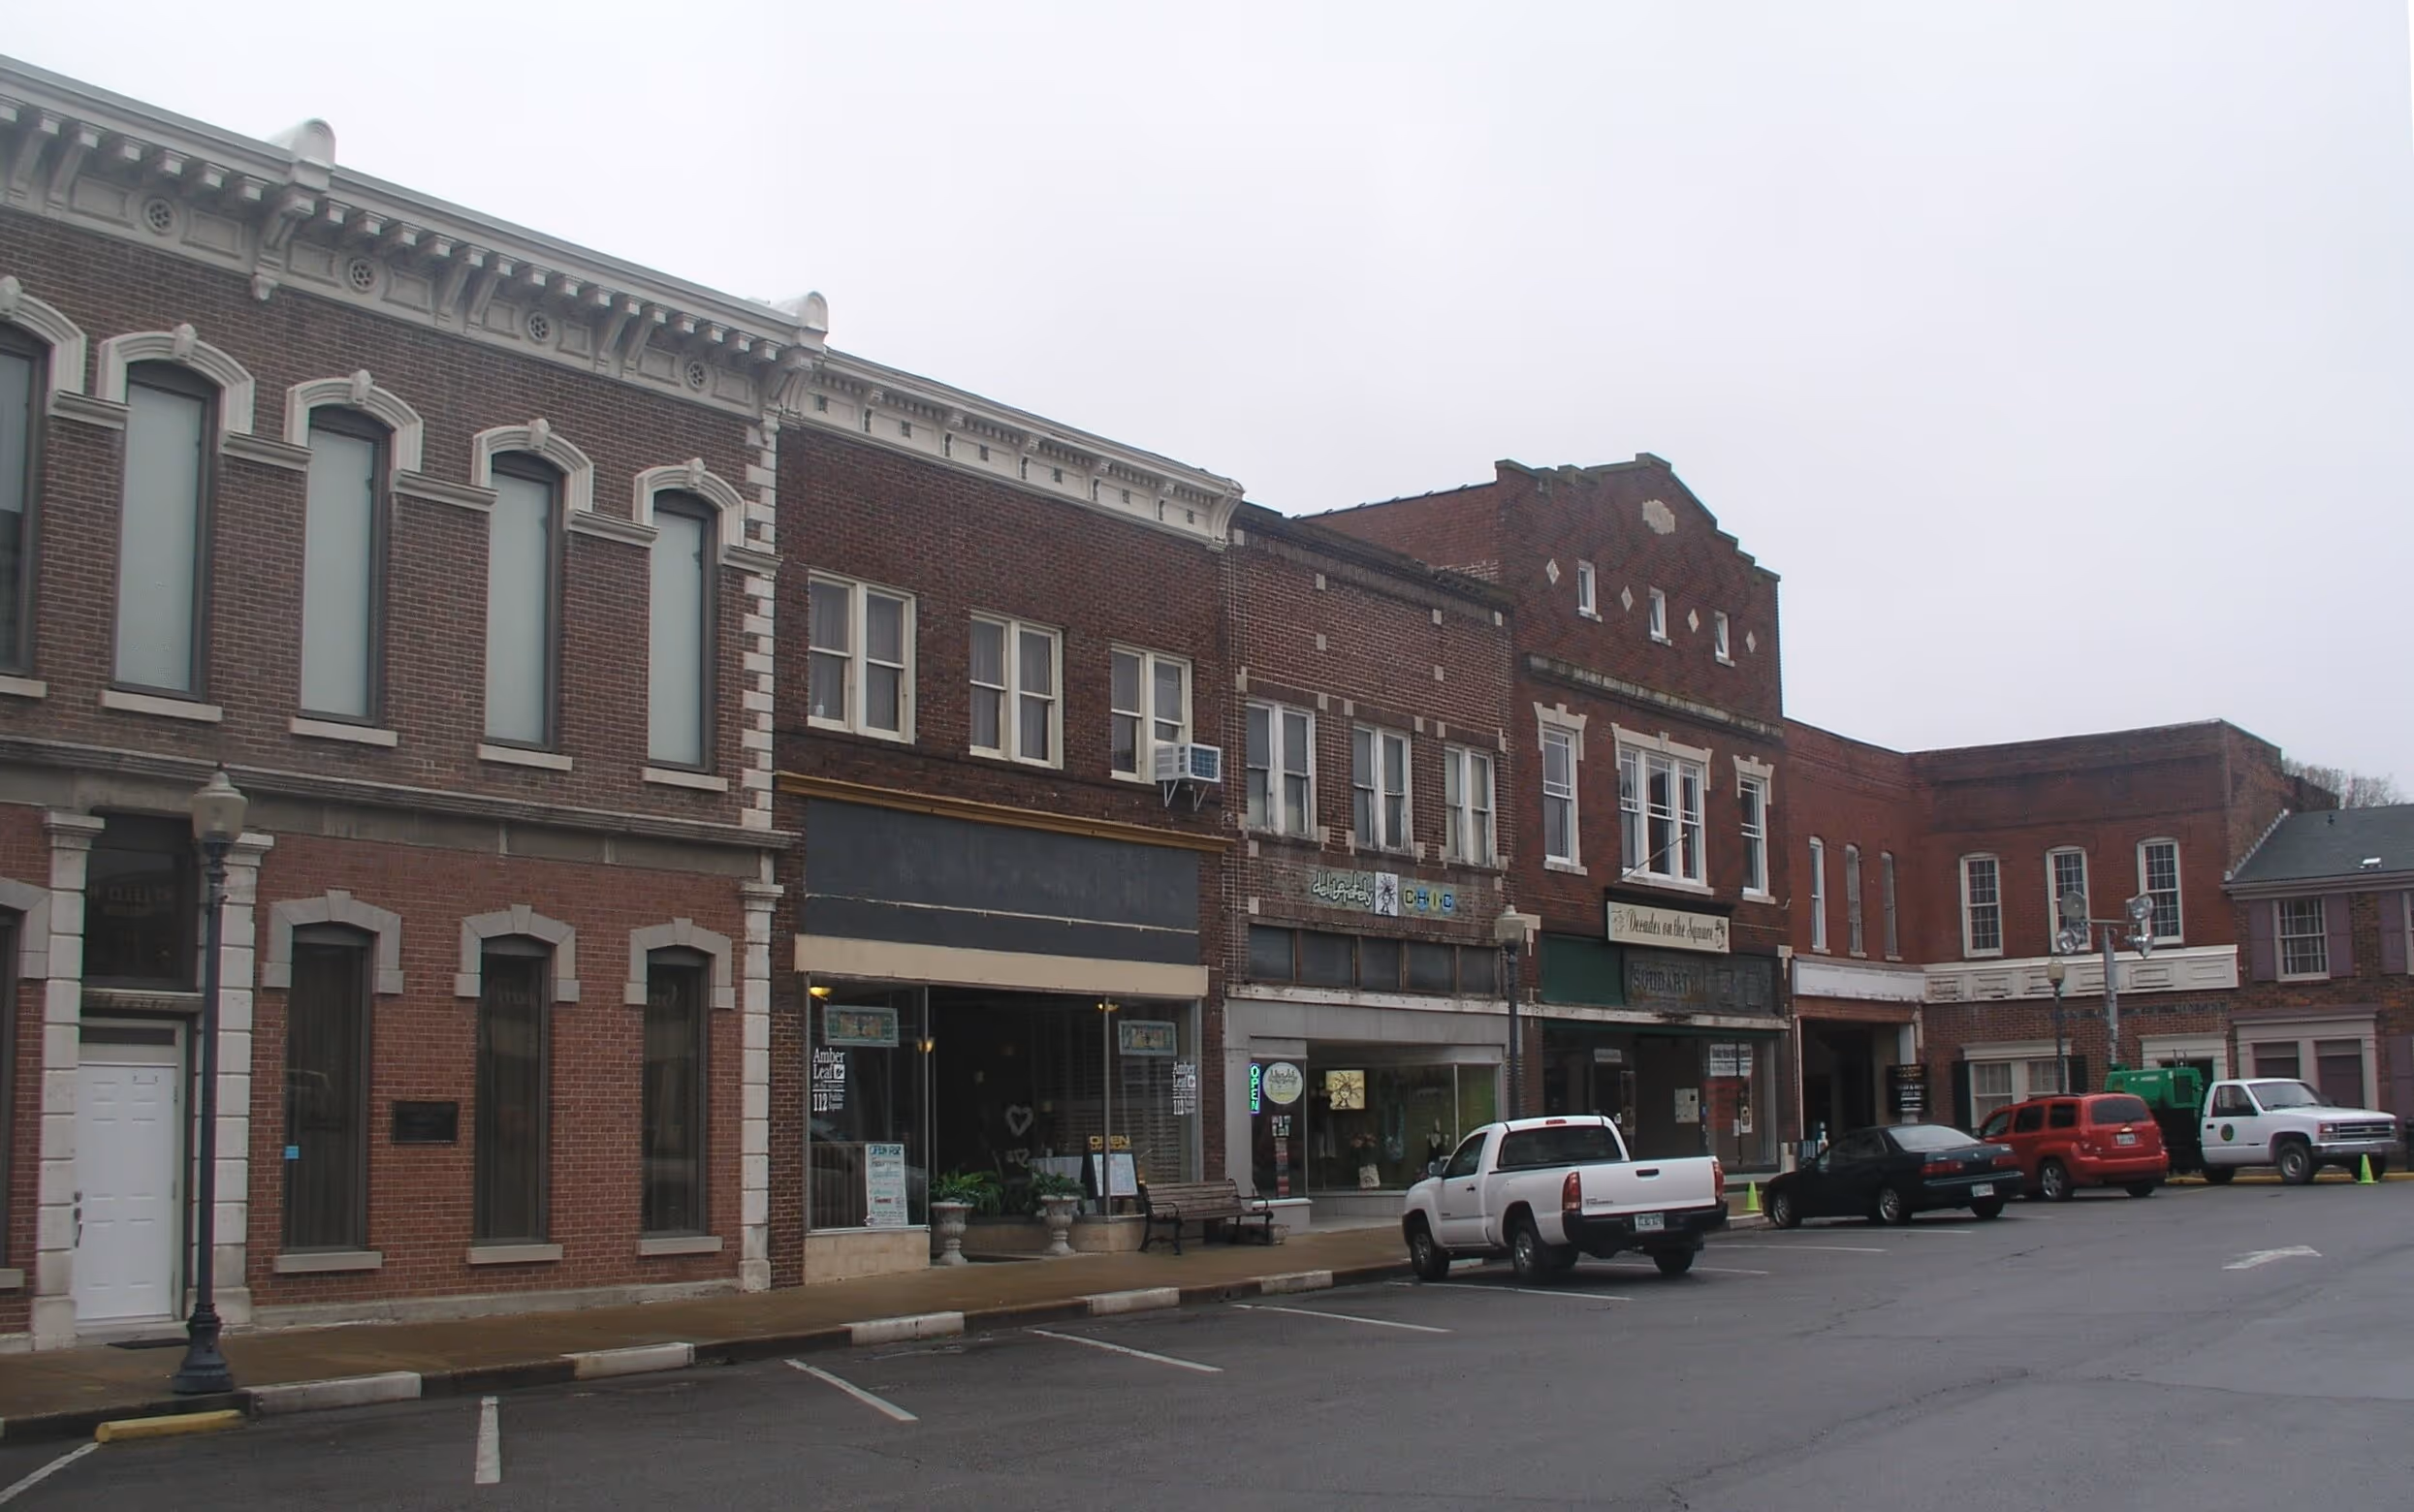
Cover image by Michael Tuszynski on Unsplash.
Dustin Shane, AICP, is an urban planner interested in exploring the intersection of philosophy, culture, and city building. He blogs about these and other topics at placeandtheory.com. He and his wife Maude are natives of Nashville and Middle Tennessee and enjoy fishing, local history, house spotting, and cooking.