Is Your City Infrastructurally Obese?
Job growth, fostering a startup culture, and maintaining a high quality of living. These are the stated goals of city and business leaders everywhere.
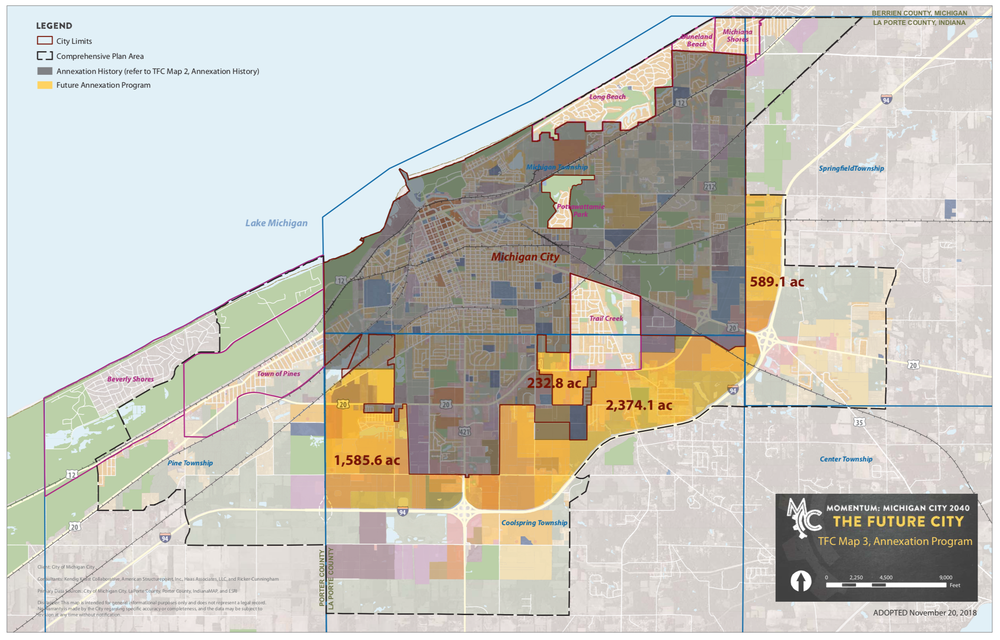
My old town of Michigan City, Indiana is no different. Over a 16-month period, Michigan City developed a growth plan called Momentum: Michigan City 2040 Comprehensive Plan (PDF). According to this document, Michigan City’s goal is to expand city limits by 37% (7.4 square miles) and to develop around 9.23 square miles of land inside and right outside the city borders. The additional land is meant to support the projected 10,347 residents expected to move to the city by 2040.
On the surface, this may seem reasonable enough. Michigan City’s current population hovers just over 31,000. If they are going to add one-third more people, don’t they need one-third more land?
But this plan overlooks something important, and in this Michigan City can be a stand-in for cities and towns all over North America: Michigan City is suffering from what I call “Urban Infrastructural Obesity.”
Urban Infrastructural Obesity
Here is what I mean by Urban Infrastructural Obesity, or UIO:
In living creatures, obesity is caused by an energy imbalance — an imbalance of calories consumed versus calories burned. We can apply this to our cities too — complex living systems in their own right — by comparing infrastructure (calories consumed) to population and activity (calories burned). Infrastructure includes the size and number of streets, bridges, commercial spaces, homes and public spaces, utilities infrastructure, etc. Activity refers to how much those things are used by the people who live there. It also includes the use of fixed assets (machinery, vehicles, appliances) and liquid assets of a city relative to its size and population.
Put simply, an infrastructurally obese city is one that has much more infrastructure than it uses.
There are several indications Michigan City is infrastructurally obese. In this sense, Michigan City, Indiana is like thousands of communities across the United States (there is an infrastructural obesity epidemic in our country) and can be a useful object lesson for all our cities and towns.
When dealing with weight in humans, doctors have identified body mass index, waist circumference, and waist/hip ratio as “simple and effective indicators of obesity.” In cities, some of the indicators for infrastructural obesity include the following:
Population to Land Area Ratio
Overbuilt Streets and Underused Sidewalks
Excess Real Estate and Excess Parking
I’m going to describe how these indicators are on display in Michigan City and why adding thousands of additional acres to the city, along with millions of dollars in infrastructure, is actually the last thing the city needs. It’s like trying to lose weight by consuming more pizza and beer.
As you read, consider whether your own city or town is infastructurally obese.
UIO Indicator #1: Population to Land Area Ratio
The first thing we should look at to determine if a city is suffering from UIO is whether there has been a change in a city’s population relative to its land area. A substantially disproportionate change in either is a telling barometer. It suggests either a large migration of people out of the city, excessive annexation of land, or both.

I’ll cut to the chase: based on this indicator alone, Michigan City is easily classified as an infrastructurally obese city. This is due to how many residents have left over the last few decades.
Many midwestern cities have experienced population flight. Some have experienced anywhere from a 15% to 60% decline from their peak population. For example, Detroit’s peak population hit 1,623,452 in 1940. By 2017, it was just 673,104. This a 58% decrease. Here is how other midwestern cities have fared:

Figure 3.
Michigan City hit its peak population of 39,369 in 1970. Since then it has dropped by 21%. Yet in terms of land area, Michigan City is roughly the same size today as it was when the decline began and annexation of land began to taper.
Thus, Michigan City’s infrastructure is at least 21% larger than necessary.
Why is Michigan City predicting that it will gain back all of its population losses from the last 50 years? According to one city council member I talked with, city officials believe Michigan City will grow again once the South Shore Line Double Track project is completed. This $416 million project is expected to cut travel time to Chicago in half (from two hours to one). Even if this prediction is correct, it doesn’t explain why Michigan City needs a 37% increase in land to support roughly the same population it had 50 years ago.
UIO Indicator #2: Overbuilt Streets and Underused Sidewalks
Another factor negatively contributing to the health of cities, including Michigan City, is the size of their streets.
Most major cities’ road systems take up 25%–35% of the city’s land area. For more suburban areas the percentage is smaller, around 15%-20%. Michigan City falls in the latter category, with 15.2% of its land area covered by right-of-ways. (Figure 4 shows the full breakdown.)

Besides this, Michigan City — as with many other small cities in the U.S. — has arterials and residential streets as wide or wider than roads in neighborhoods in New York City and Chicago, whose populations are literally 77 to 228 times larger (see Figure 5). The average national standards for street width is 29, 35, and 39 feet. This does not include sidewalks, which if added, would increase the averages to between 40 and 60 feet. In all cases, the size is set to support both curbside parking on each side of the street and two lanes if zoning permits. By some estimates, a two-lane road has the capacity for 8,000-10,000 cars per day per lane.
Michigan City does not provide traffic volume data on most residential streets, only for its significant arterials and a few other streets of interest (Figure 6). For the roads they do measure, according to my calculation, the annual traffic volume is roughly 60% lower than capacity.


Regarding sidewalks, the foot traffic on the streets in Michigan City is even sparser than vehicle traffic. According to the U.S. Census Bureau, the most common method of commuter transportation was driving alone at 82.1%, with carpooling, public transit, and walking clocking in at 9.5%, 1.98%, 3.05% respectively. Some roads still don’t have sidewalks to walk on, forcing pedestrians to walk right next to fast-moving vehicles.
If Michigan City was built more compactly — or if government officials there focused on “thickening up” the city rather than extending outward — more people would be able to walk or bike. This is the case in much larger cities. Consider Tokyo, Japan. Kids as young as three and four can be spotted going to and from bakeries and grocery stores for their parents. (Some of these are secretly filmed, with the permission of parents, and aired as the popular Japanese TV show My First Errand.)
Weather alone isn’t reason enough to disqualify bike commuting. In Copenhagen, a city with a population of 777,000, the number of people that use bikes to get to work sits at an astonishing 35%, compared to the U.S. national average of 0.6%. When it comes to snowfall, Copenhagen receives even more snow annually than Michigan City (55 inches versus 47 inches). The same is true of rainy days. Copenhagen receives an average of 170 days of rain per year, while Michigan City receives just 138.
UIO Indicator #3: Excess Real Estate and Excess Parking
Quite apart from the thousands of new homes the city hopes will be built in newly annexed neighborhoods, Michigan City’s existing real estate also points to urban infrastructural obesity.
According to NeighborhoodScout.com, the estimated vacancy rate of residential homes in Michigan City is 14.4%. Nearly two-thirds of homes are single-family homes (this doesn’t include apartments and mobile homes). More than 55% of homes across all types have at least three bedrooms. And yet, according to the Census Bureau, 34% of Michigan City residents live alone. These numbers — not to mention the 24% of undeveloped land within the current city limits (see Figure 4 above) — all suggest that there is plenty of existing housing opportunities that can be filled in before growing outward.
We see a similar pattern with commercial real estate. While I don’t have data on Michigan City specifically, I do have some on the region. Office vacancy across Northwest Indiana rose to 19% last year, up from 14% in 2017. According to Merrillville-based Commercial In-Sites’ annual Northwest Indiana Office Market Survey, only about 35% of the Region’s multi-tenant office buildings are now fully occupied. If Michigan City’s vacancy rate is roughly equivalent to the broader region’s, then there are a lot of acres of commercial land available in the current city limits; the proposed annexations will add very little to the available supply (again, see Figure 4 above) and will diffuse commercial activity across an even greater area.
And then there is the parking.
Between every building and empty lot, there is parking. Estimates vary, but experts say there are at least 3.4 and as many 8 parking spots for every car in the United States. One of the primary culprits? Parking minimums. Many cities have adopted these off-street parking minimums. It seems that, for every kind of land use and business, there are parking requirements to go with them. Some seem strangely arbitrary. Some towns may demand, for instance, that a barbershop must have 2 spaces per barber, but for a beauty shop 3 per beautician, or one parking space per 10 nuns at a nunnery, 3 per hole for a golf course or driving range, or one parking spot per 3,000 gallons of water at a public swimming pool.
There are also parking requirements based on building size. Some of these requirements result in parking lots that far exceed the size of the buildings they are mean to support. In a talk he gave in 2014, Donald Shoup uses San Jose, California as an example:

Michigan City follows a similar pattern. There are many commercial buildings with parking lots larger than the establishment they support. The south Franklin business district comes to mind. But, in fact, this is commonplace across many cities.
Conclusion
Ultimately, urban infrastructural obesity acts as a barrier to those who want to live and work in a city.
A city suffering from UIO is often highly dependent on cars, which exacerbates the problem while also impeding social connections.
Business owners and entrepreneurs find that — if an area lacks foot traffic, and stores and residential spaces are spread out — underused infrastructure becomes a burden rather than an asset. Even established companies considering opening up new branches in other parts of a city might think twice because of bloated infrastructure. As people move to preferably dense places, productive businesses follow.
What Michigan City wants is what many post-industrial cities want: to bounce back. This is the understandable hope of its residents, businesses, civic leaders, and all who love it. The idea of revitalizing a town by expanding its borders and building new real estate is a visible example of progress and easy to comprehend. You can see why it’s so tempting.
But what expansion in Michigan City will do is what it does in all infrastructurally obese places. It will compound the problem, both now and into the future. What’s needed isn’t more land and infrastructure, but rather a hard look in the mirror, an acknowledgement that we can’t solve today’s problems with the same mindset that got us here, and the community-wide resolve that next few decades will be different.
Top photo by James Sullivan.