How Much Does a Mile of Road Actually Cost?

%20(1).avif)
%20(1).avif)
.avif)
%20(1).avif)
Here’s one of the most common questions we get asked by our readers and members of the Strong Towns movement:
How much does it actually cost to pave, or repave, a mile of road?
This is a tough question to answer straightforwardly, because the answer is extremely variable. And yet it’s a necessary question to grapple with if you’re trying to demonstrate to someone that the place you live is accumulating infrastructure liabilities it will not be able to keep up with.
Buried in a report from the Federal Highway Administration is a really useful chart that may help you to present that case, to better understand the liabilities your own local government faces, or to know when somebody is pulling the wool over your eyes. Here’s the chart, from Appendix A-3 of the biennial Status of the Nation’s Highways, Bridges, and Transit: Conditions & Performance (23rd Edition), a report the U.S. Department of Transportation prepares for Congress.
Take a look at the numbers first; then we’ll get to the caveats:
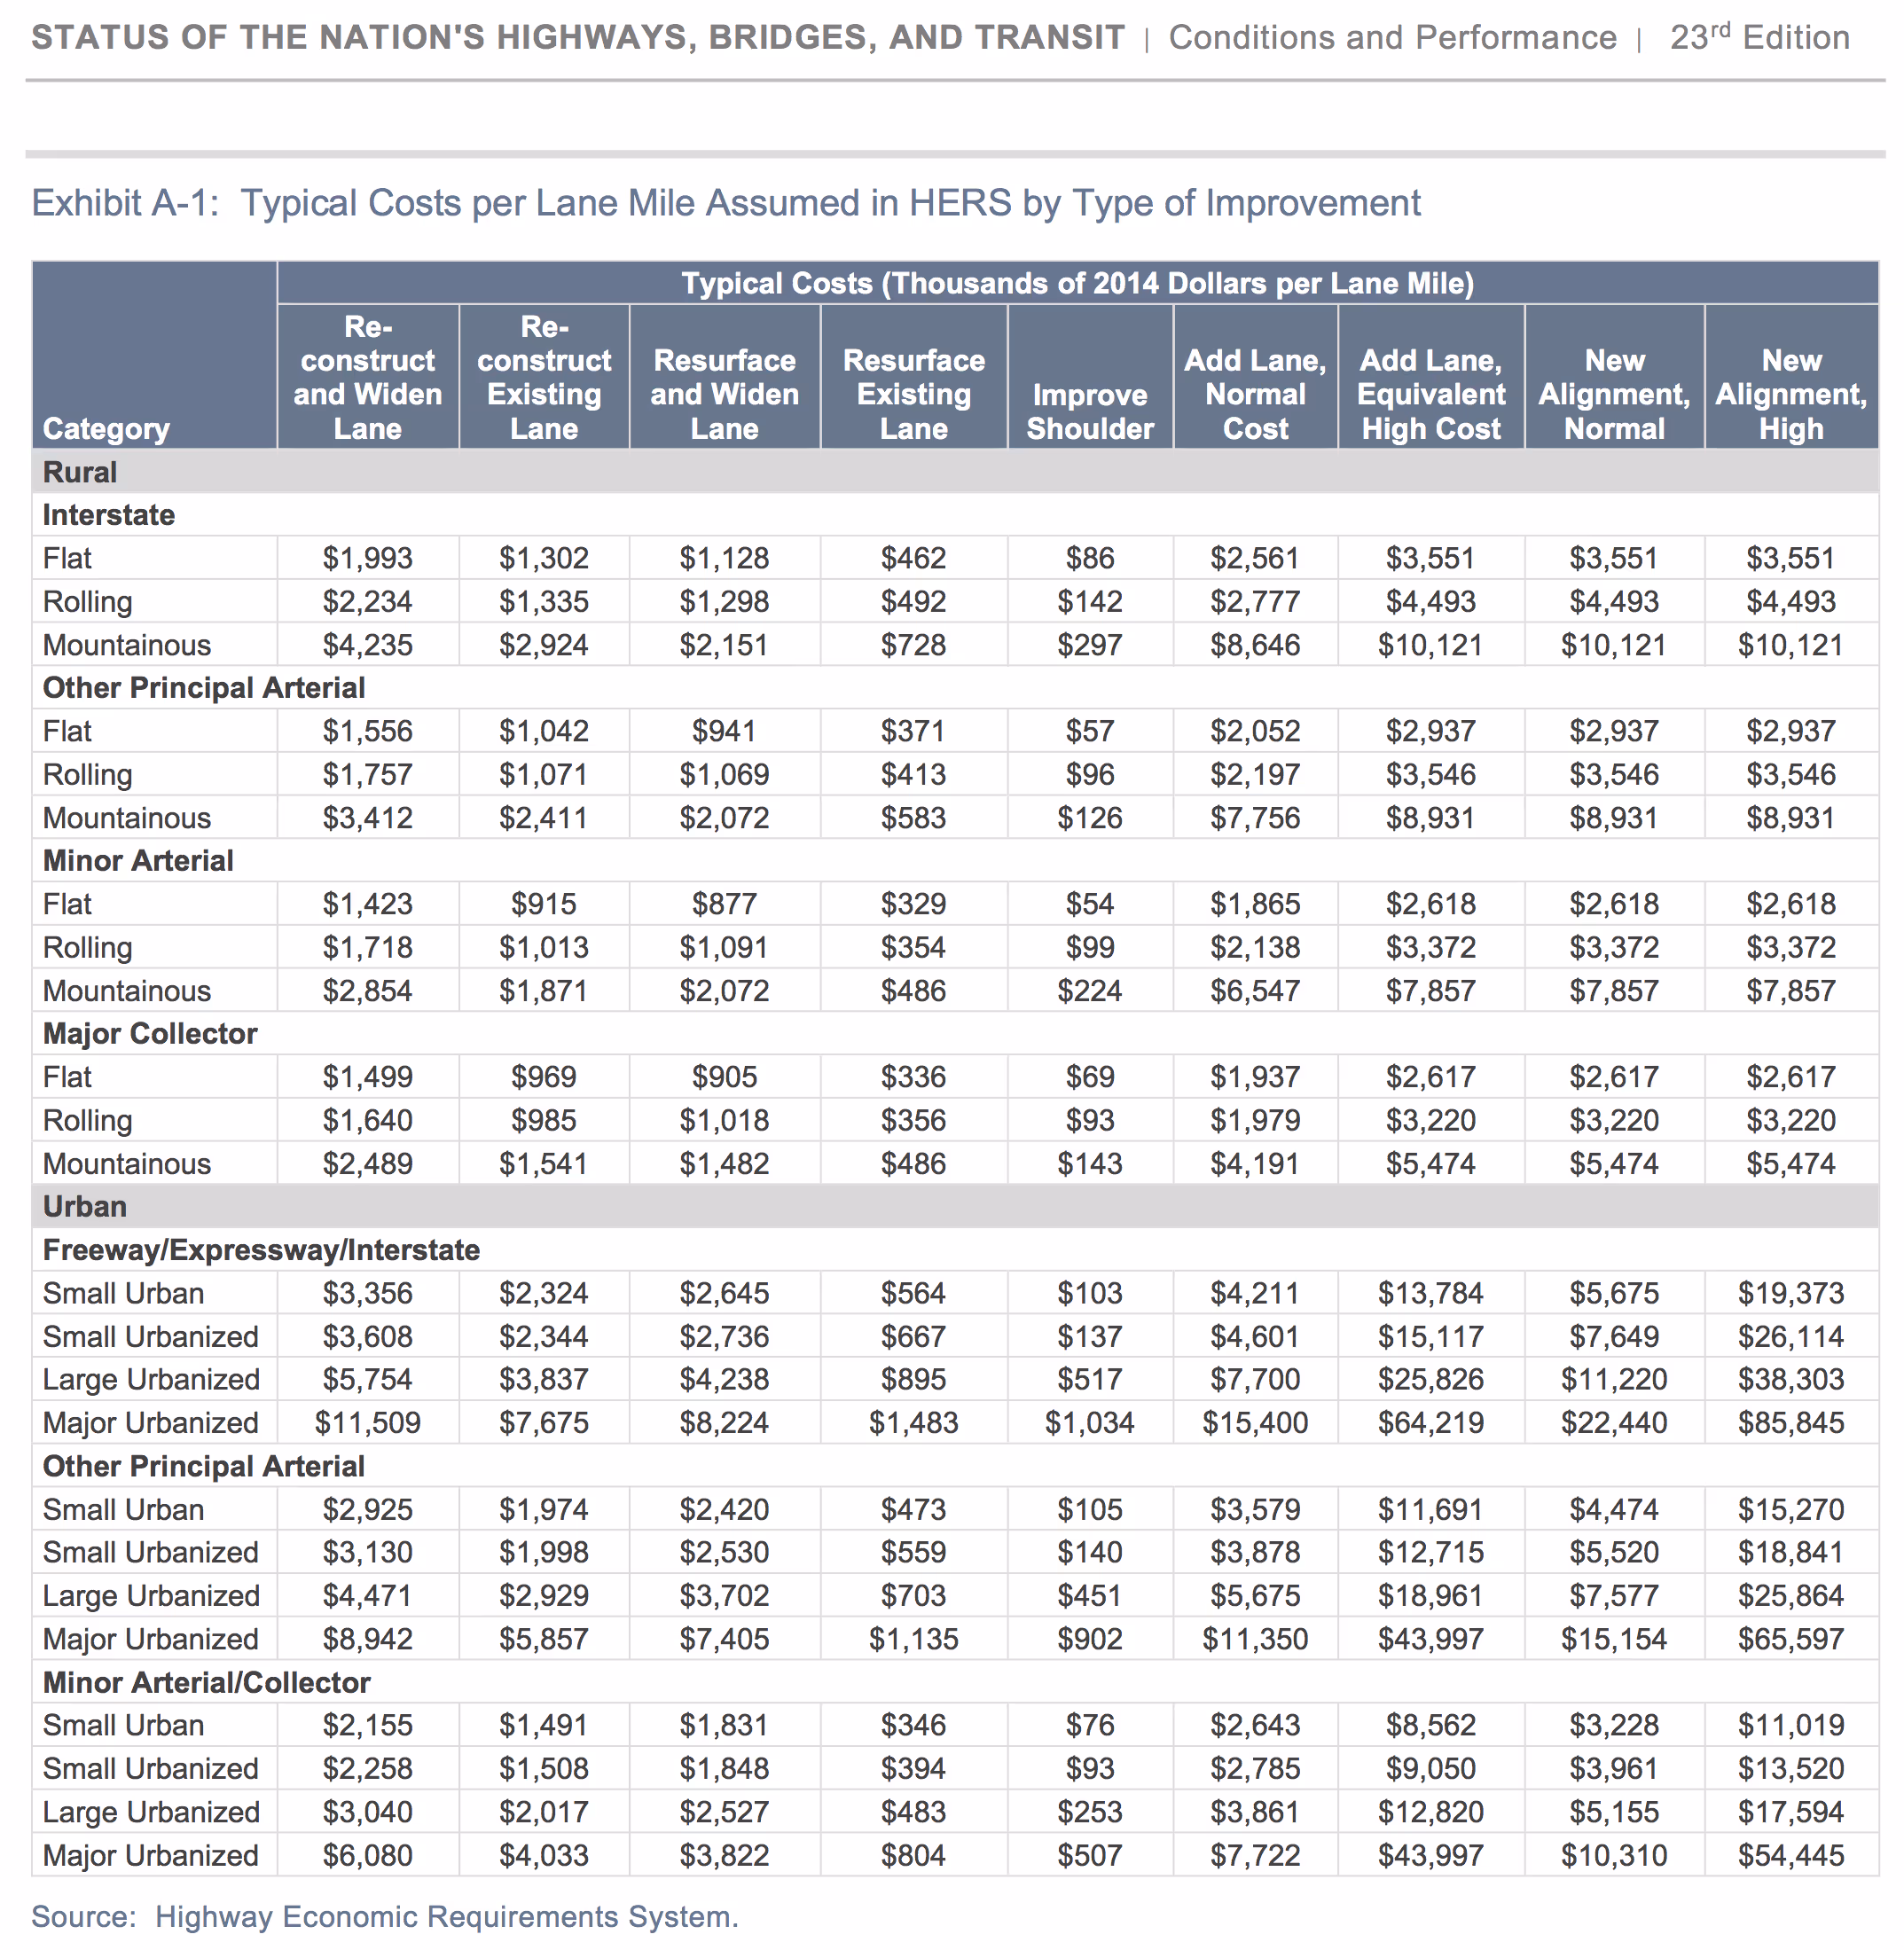
These numbers are all in thousands of dollars. So, for example, a representative cost in 2014 for reconstructing an existing lane of a major urban freeway was $7.7 million per mile; doing the same on a collector street in a small urban area would have set you back $1.5 million per mile.
The "urbanization” categories reflect the size of a city or metropolitan region: small urban (populations of 5,000 to 49,999), small urbanized (populations of 50,000 to 200,000), large urbanized (populations of more than 200,000), and major urbanized (populations of more than 1 million).
The FHWA provides a qualifier:
These costs are intended to reflect the typical values for these types of projects in 2014, and thus do not reflect the large variation in cost among projects of the same type, even in a given year. Such variation, which is evident in the project-level data on which these typical values are based, is attributable to several location-specific factors…. Among other factors that could make costs unusually high are complicated interchanges, major environmental issues, and other extreme engineering issues.
A couple things to keep in mind if you’re an advocate looking to push your city, county, or state DOT to make responsible infrastructure decisions:
1. The right level of precision depends on the context; don’t get “analysis paralysis.”
The cost of any large-scale engineering project is highly variable and subject to the unexpected. If your goal is to make a general point about the costs and trade-offs of, say, expanding roads, or that the revenue from new development over 30 or 50 years is likely to prove inadequate to fund the maintenance associated with that development, then you likely don’t need precision to the nearest 100 or 1000 dollars. Instead, make conservative assumptions (i.e. use low-end estimates of costs).
Sure, sometimes you need to get into the weeds of a specific proposal and how realistic its assumptions are. But when you’re speaking more generally about the financial sustainability of the place you live, here’s a good rule to live by: if you can show that there is a problem even under a best-case scenario, you will be more convincing than if you let opponents bog you down in the nitty-gritty of where your numbers come from and exactly how precise they are.
2. The question of what’s actually “needed” is a question of politics more than engineering.
Much of the FHWA report this chart comes from reads as the kind of Infrastructure Cult propaganda that is designed to demonstrate the “need” for more funding. This doesn’t mean that the numbers presented within are fraudulent. Rather, what every Strong Towns advocate should remember is that questions of priorities are where the rubber really hits the (potholed, in obvious dire need of reconstruction, and hey, let’s widen the lanes and throw a shoulder in there while we’re at it) proverbial road.
The remarkable range of costs across any one row of the chart horizontally reflects that there’s a huge difference between different activities that might all be sold as “maintenance.” The broader report the chart is embedded in makes crystal clear—as our friends at the Frontier Group recently documented—that we, collectively, are spending way, way, WAY too much expanding the road system instead of maintaining what we’ve built.
Data is a powerful weapon in the right hands. But keep your eyes on the goal.
Charles Marohn (known as “Chuck” to friends and colleagues) is the founder and president of Strong Towns and the bestselling author of “Escaping the Housing Trap: The Strong Towns Response to the Housing Crisis.” With decades of experience as a land use planner and civil engineer, Marohn is on a mission to help cities and towns become stronger and more prosperous. He spreads the Strong Towns message through in-person presentations, the Strong Towns Podcast, and his books and articles. In recognition of his efforts and impact, Planetizen named him one of the 15 Most Influential Urbanists of all time in 2017 and 2023.