Denver Crash Map Reveals the Deadly Toll of Stroads

An interactive map, put together by citizen advocates, showing crashes in Denver. (Click here to view.)
Before the internet, police stations would put color-coded pins in large-scale wall maps to document traffic crashes and deaths. Crash reports with all the vital data were in separate paper files. And it was seriously difficult for regular citizens to research safety in their neighborhoods.
Nowadays, a dedicated citizen advocate with publicly available information and basic technical skills can put together an interactive map chock full of vital safety data. That’s just what one safety-minded citizen in Denver did, and one look at their impressive map tells a sad but familiar tale: Stroads are disproportionately deadly.
Among many glaring examples depicted by this map, one three-mile stretch of Federal Boulevard between West Dartmouth and West Exposition shows 16 deaths between 2014 and 2023. In clinical police terms, these are the stats and facts: 2500 S. Federal, 6/10/18, 1 fatality, 1 seriously injured; 2800 S. Federal, 9/12/20, 1 fatality; S. Federal and Yale Ave., 5/5/22, 1 fatality, 3 seriously injured.
Now look at the same road in Street View.

Look familiar? Note the pedestrian on the scary median. There are four lanes of high-speed traffic, slip lanes for turns, and driveways occupying large stretches of sidewalk. The nearest crosswalk traverses eight lanes of traffic. Another warning sign is state route designation (CO-88). Everything about this stroad is deadly, for cars and non-drivers alike.
The same goes for a long stretch of Colfax Avenue (CO-70), which shows more than a dozen pins representing fatal crashes.

The default setting for this map shows only crashes with fatalities. But if you click on the toggle for serious accidents with injuries, the scale of the carnage is even starker.
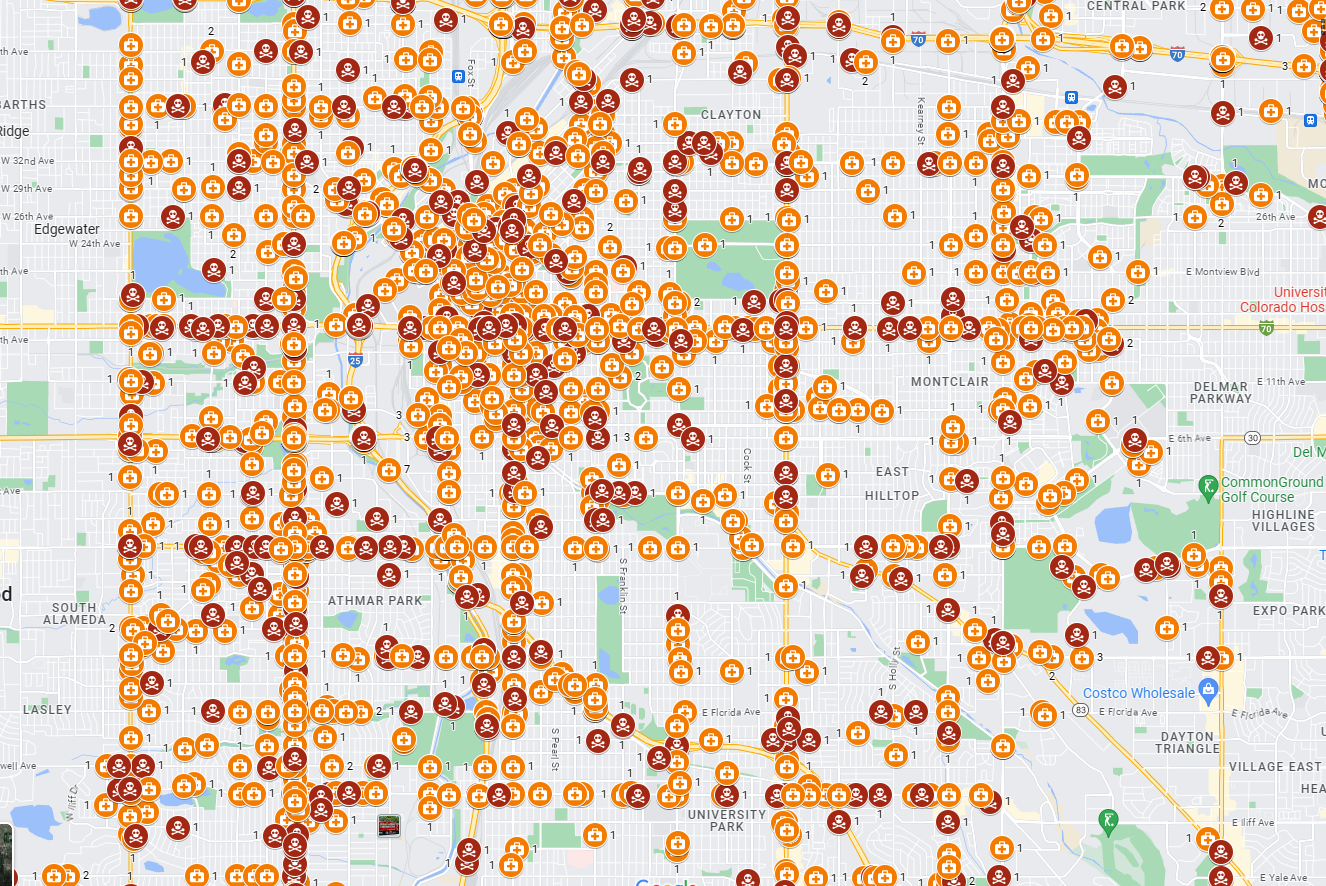
You’ll also notice large swaths of the map with no fatalities. Almost all of them have something in common, a traditional street grid.

Denver knows it has a problem, and has admirably committed to achieve “Zero traffic-related deaths and serious injuries by 2030.” The city’s Vision Zero dashboard transparently documents crashes and fatalities (including a less user-friendly version of the crash map), and this year’s tally of 70 traffic deaths in 2023 shows it has an uphill path to achieve its goals.
Tools like this map offer a powerful visual argument to fix a development pattern that has made North America less safe and less prosperous. Do one for your own town or city and bring it to the next council meeting.
And if you’re in Denver, join the Strong Towns Local Conversation and support their battle to make the city’s streets safer for all users!
RELATED STORIES


Change everything.
Here’s the program that will revitalize your city.
Ben Abramson is a Staff Writer at Strong Towns. In his career as a travel journalist with The Washington Post and USA TODAY, Ben has visited many destinations that show how Americans were once world-class at building appealing, prosperous places at a human scale. He has also seen the worst of the suburban development pattern, and joined Strong Towns because of its unique way of framing the problems we can all see and intuit, and focusing on local, achievable solutions. A native of Washington, DC, Ben lives in Venice, Florida; summers in Atlantic Canada; and loves hiking, biking, kayaking, and beachcombing.