Everything that’s wrong with America in 2 charts? Yeah, right.
I spent the end of last year and the beginning of this year studying the work of the moral psychologist Jonathan Haidt. Part of that was a coping mechanism; like many Americans, I've struggled with the strident and self-righteous tone our national dialogue has emphasized. Whatever nuance we once had seems to have disappeared. Haidt helps explain what is happening and, more importantly, how to handle it. I've made changes in my life based on his work.
Studying Haidt was also a way to challenge my own thinking. In the last paragraph of the following essay, I wrote about how many of us struggle with the tone we are surrounded by but, I must ask myself, is this because I don't care for the tone or the beliefs behind it? Am I, at times, strident and self-righteous when engaging on a point I feel passionate about? Does my thinking at times lack nuance?
The answer, of course, is that I'm as flawed as any of us in this regard. Understanding Haidt's work, and related work on brain development, evolutionary psychology and human behavior, has helped me appreciate my own shortcomings and, hopefully, put me on a path to being a better communicator.
It's also helped me be more understanding of where others are coming from. I've come to a place — and I think it's a healthy place, at least for me — where I can disagree with someone without believing they are wrong. If a person can hold two contradictory thoughts in their head with minimal internal tension — it's called cognitive dissonance and we all do it — then certainly two people can hold contradictory thoughts without tension being necessary.
Haidt has also helped me understand another human flaw: We — especially those people who believe they are wholly rational — first have a belief and then search out information to support that belief. Very few people ever change their mind based on scientific facts or data. People change their minds only in a respectful dialogue with those around them, people whom they admire and trust giving them information that contradicts core beliefs, yet in a way that is respectful of those beliefs.
The piece we're sharing today, originally published earlier this year, looks at an article in which the author had a belief — the federal government is not spending enough on infrastructure — and then searched out data to support that belief. The data is there, and the article is not wrong, but the analysis fails to grasp the entirety of what is going on, which is much different than what the simple data suggests. We all do this — even we at Strong Towns — which is why having contradictory voices among our friends, colleagues and others we respect is so important. It's those contrary voices we listen to that keep us honest to ourselves. - Chuck
This summer, several people sent me an article from Jacobin Magazine, a publication I had not heard of until recently, and they wanted my response. The article — "Why the United States is falling apart" — details, in just two handy charts, everything that is wrong with America. (Although the writer congratulates himself for being above such a clickbait title, I couldn't resist.) The central premise of the article is summed up with this quote:
Hurricane Harvey is only the latest reminder that the US infrastructure is falling apart — a situation that becomes more urgent as the climate crisis bites harder. Here’s a data series that goes a long way to explaining why. In simple English, the public sector is barely investing enough to keep up with normal decay, let alone doing anything to improve things.
The two charts depict Net Civilian Public Investment (as a percentage of GDP) and the downward slope of both charts clearly represents our lack of commitment to funding basic infrastructure.

The analysis and conclusion here are simple and, as our readers understand, quite predictable:
For the full decade of the 1930s, [Net Civilian Public Investment] averaged 2.6% — the same as the 1960s, a time of dramatic expansion in the public sector. Since then, it’s been mostly downhill.
To get back to that 2.6% average would mean an increase of $400 billion a year in public investment. (For details on the shortfall, and where the spending needs to be directed, see the American Society of Civil Engineers’ annual report on the topic.)
There’s no doubt the US could afford that. But our political system is completely incapable of formulating the problem.
Put another way: "In the 1930's we loved America and invested in infrastructure. Then the war...yada yada...and it took us a while to find our soul again but, thankfully, we did in the 1960's where we again spent like we meant it. Since then our government has been in the hands of the stingy or the downright cruel and our public infrastructure investments have declined, as is visible in everything falling apart around us. Just spend more and — poof — problem solved. We can afford it."
Let me explain to you what is really going on because it's not what these charts purport to represent.
Always understand that when something is shown as a percentage of something else, you need to ask what is happening to that something else. In this case, everything is normalized to Gross Domestic Product (GDP). That means everything is divided by GDP, which has expanded greatly in every decade represented on the charts. When the denominator of a fraction is growing, to keep the line flat the numerator needs to grow by the same amount. This has always baffled me when it comes to infrastructure. Don't we invest in infrastructure to grow the economy? If we're successful in making good infrastructure investments, shouldn't the economy grow way faster than our infrastructure spending grows?
More important than that bit of intellectual silliness (because people arguing that these are great investments then arguing that the rate should therefore increase as fast as GDP is silliness) is the notion that the charts are a net investment.
Net Investment = Total Investment - Total Depreciation
So what you are seeing here is the amount we spent minus the amount that what we already have depreciates in value. One way to look at this — the Jacobin way — is that we're not spending enough to keep up. Another way to look at this — let's call it the Strong Towns way — is that we've built so much stuff, most of it unproductive, that we're overwhelmed with depreciation (decline).
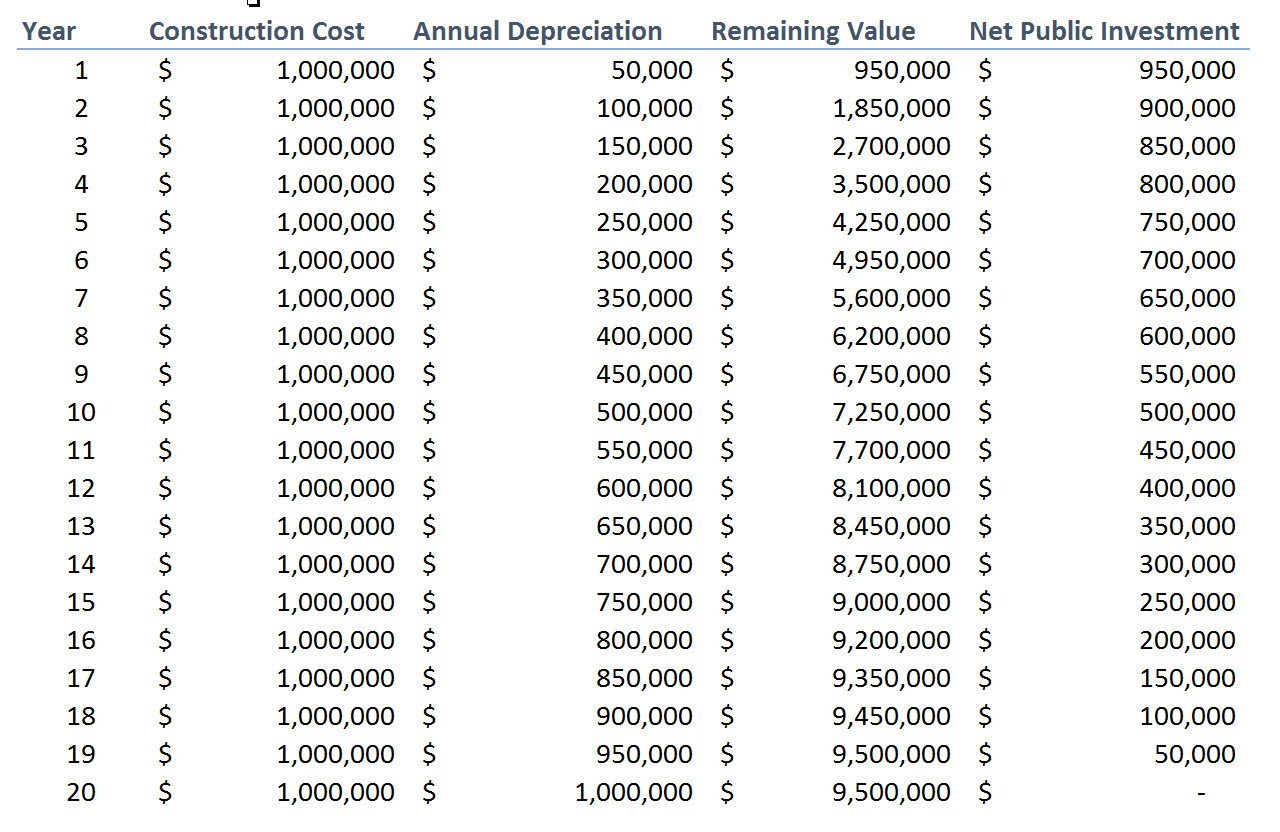
Here's how it happens: Let's consider a bridge that costs $1 million to build. I'm going to leave out inflation, interest, etc. and just do a straight line depreciation (thought those things would make it look even worse than what I'm showing).
Assume the bridge is designed to last 20 years and then it will need to be replaced. So each year it depreciates 1/20th of the cost, or $50,000. As the table and chart below show, by just focusing on one bridge, we see a positive Net Public Investment in Year 1 and then a negative Net Public Investment every year thereafter. We built a bridge but, by Jacobin logic, we spent 19 out of 20 years shortchanging the public.


(Note again that we could divide this by GDP — a number that is generally increasing — and that would make the line slope downward. But there's no sense in piling on because I'm trying to help you understand what is happening.)
Now, let's say that, instead of building just one bridge, we build a new bridge every year. For the same twenty years, we now spend 20x the amount in the first example — a serious public investment — and each year we add to the depreciation backlog. This creates a downward sloping Net Public Investment ending in $0 in the final year shown. So, no there is no net public investment by the end even though we've spent $20 million building a lot of bridges, consistently spending each year along the way.

I want to pause here and note that — while the Jacobins may find this contemptible — this system actually works. If this theoretical nation with its twenty bridges now shifted its $1 million a year budget into maintaining and replacing those bridges, it could replace one a year indefinitely. That's a pretty sweet and stable situation, even though net public investment would be zero. It's kind of silly and counterproductive to suggest that this nation should always increase the amount it spends on bridges.
Let me say this more clearly in a Strong Towns way: Zero net public investment means we're keeping up with depreciation. We're fixing what we have. Spending above that line is what we're investing in new infrastructure. So, here's what the chart would look like after Year 20 if we stopped building new bridges and switched entirely to maintaining what we have.

In that chart, we're still spending a million dollars a year. There has been no disinvestment in infrastructure, just a shift towards maintenance. By Jacobin's translation, this would be reckless public policy. In Strong Towns' world, this is the only responsible thing to do.
In the two Jacobin charts, we don't see everything that is wrong with America. What we see is a nation struggling to shift from one model of growth to another. We see a nation used to quick and easy growth from top-down government investments in infrastructure now struggling under the maintenance burden of all that unproductive asphalt, steel and concrete. The simple Jacobin solution of an additional $400 billion per year wouldn't address this problem; it would make the problem much, much worse.
At Strong Towns, we understand that these problems are more complex than two simple charts will ever capture. There are a few concepts, however, that are fairly simple, no matter how elusive they are to our public policy overlords obsessed with infrastructure:
- When we build new infrastructure, it must be maintained.
- We don't currently have a system for either maximizing the productive use of existing infrastructure or growing community wealth as we maintain it.
- Such a system of building local wealth and stability is at odds with our national program oriented around GDP growth.
This tension is coming to a head and, unless power and responsibility is devolved to local governments, it will end with the bankrupting of our cities. The current math doesn't work any other way.
It's time to stop empowering the simple, top-down everything-that's-wrong-with-America-in-one-simple-chart policy rhetoric and turn our future over to bottom-up leadership from our cities, towns and neighborhoods. Trust your neighbor to join with you to make yours a strong town. It's the only way this works.
(Top image from Wikimedia)
Charles Marohn (known as “Chuck” to friends and colleagues) is the founder and president of Strong Towns and the bestselling author of “Escaping the Housing Trap: The Strong Towns Response to the Housing Crisis.” With decades of experience as a land use planner and civil engineer, Marohn is on a mission to help cities and towns become stronger and more prosperous. He spreads the Strong Towns message through in-person presentations, the Strong Towns Podcast, and his books and articles. In recognition of his efforts and impact, Planetizen named him one of the 15 Most Influential Urbanists of all time in 2017 and 2023.