Induced Demand and the Highway Interchange (Part 1)
This article was originally published in Local Urbanism, and is part one of a two-part essay. It is shared here, in slightly different format, with permission.

Everything's bigger in Texas, or so the saying goes. The Katy Freeway, a stretch of I-10 between Katy and Houston, Texas, is no exception. Built as a regular six-lane highway in the 60s, it was called the second worst bottleneck in the nation by 2004—wasting 25 million hours a year of commuter time.
In 2011, the state of Texas invested $2.8 billion to fix this issue, widening the road to as many as 26 total lanes. Problem solved! There should be plenty of room now for everyone who wants to drive! Or, so it was thought. "Should" is the word playing a big part in that sentence. The reality is not as simple.
According to City Observatory, by 2014, "the morning commute [had] increased by 25 minutes (or 30 percent) and the afternoon commute [had] increased by 23 minutes (or 55 percent)". This may seem counterintuitive, but it is a real-world example of a phenomenon known as “induced demand.” Currently, the state of Ohio and the city of Strongsville, Ohio, are heading down a similar (albeit less extreme) path. Due to induced demand, there is strong evidence that the I-71 interchange that they've mandated be built on the border between Strongsville and Brunswick may not be the congestion saving grace they hope.

Katy Freeway in 2002 (left) and 2023 (right). The state of Texas invested $2.8 billion in trying to solve congestion, but it is still one of the most congested highways in the country.
Induced Demand
Before digging into how the interchange will affect traffic, let's first talk a bit more about induced demand. Simply put: adding capacity to roadways increases traffic volume. This has been observed time and again.
Supply and Demand
Remembering back to economics class, we can recall the laws of supply and demand. Namely, we can recall that, as a good's supply increases, the cost of the good decreases. When the cost of the good decreases, demand for the good increases. This is usually thought about in terms of a manufactured good and its cost in dollars, but we can apply it here, too.
Our good in this case is obviously the road and its capacity. Our cost is not as obvious. In our case, the cost paid is not always monetary, but rather people's time, stress, comfort, fuel, and other considerations made by each person as they decide how and when to get from A to B. As with the prices of goods at a store, every person has a threshold of what they would pay—a certain time, stress level, etc. If the cost of one of these is too high, they may decide to change their route or leave at another time. If the cost of a regular route they take, such as a commute, is consistently too high, they may even decide to move. If you've ever decided to leave for work a bit early to beat the rush, you have made one of these decisions.
People will usually use a route until their specific threshold is hit. As a community, this results in a constant state where our peak times (rush hour) are at near max threshold, as any more cars on the road would increase one of the costs mentioned above, and some drivers would choose other routes or times.
Coming back to the supply discussion, if we add roadway, that would increase the supply. Increased supply of the roadway would inherently reduce the cost of driving. Reducing the cost of driving increases demand as the cost is lowered below potential drivers’ thresholds. These drivers then take to the roads when they otherwise weren't driving there and then. This decreased cost resulting from the increased supply is what every road project is chasing. Every road "upgrade" looks at the decreased cost as the end goal without taking into account (or giving enough weight to) the fact that more people will be incentivized to drive at the worst times. In reality, adding capacity to a road reduces the cost and incentivizes new people driving until the cost reaches that threshold once more. At that point, we are right back to the congestion, just with the added maintenance cost of new infrastructure and more of our city paved.
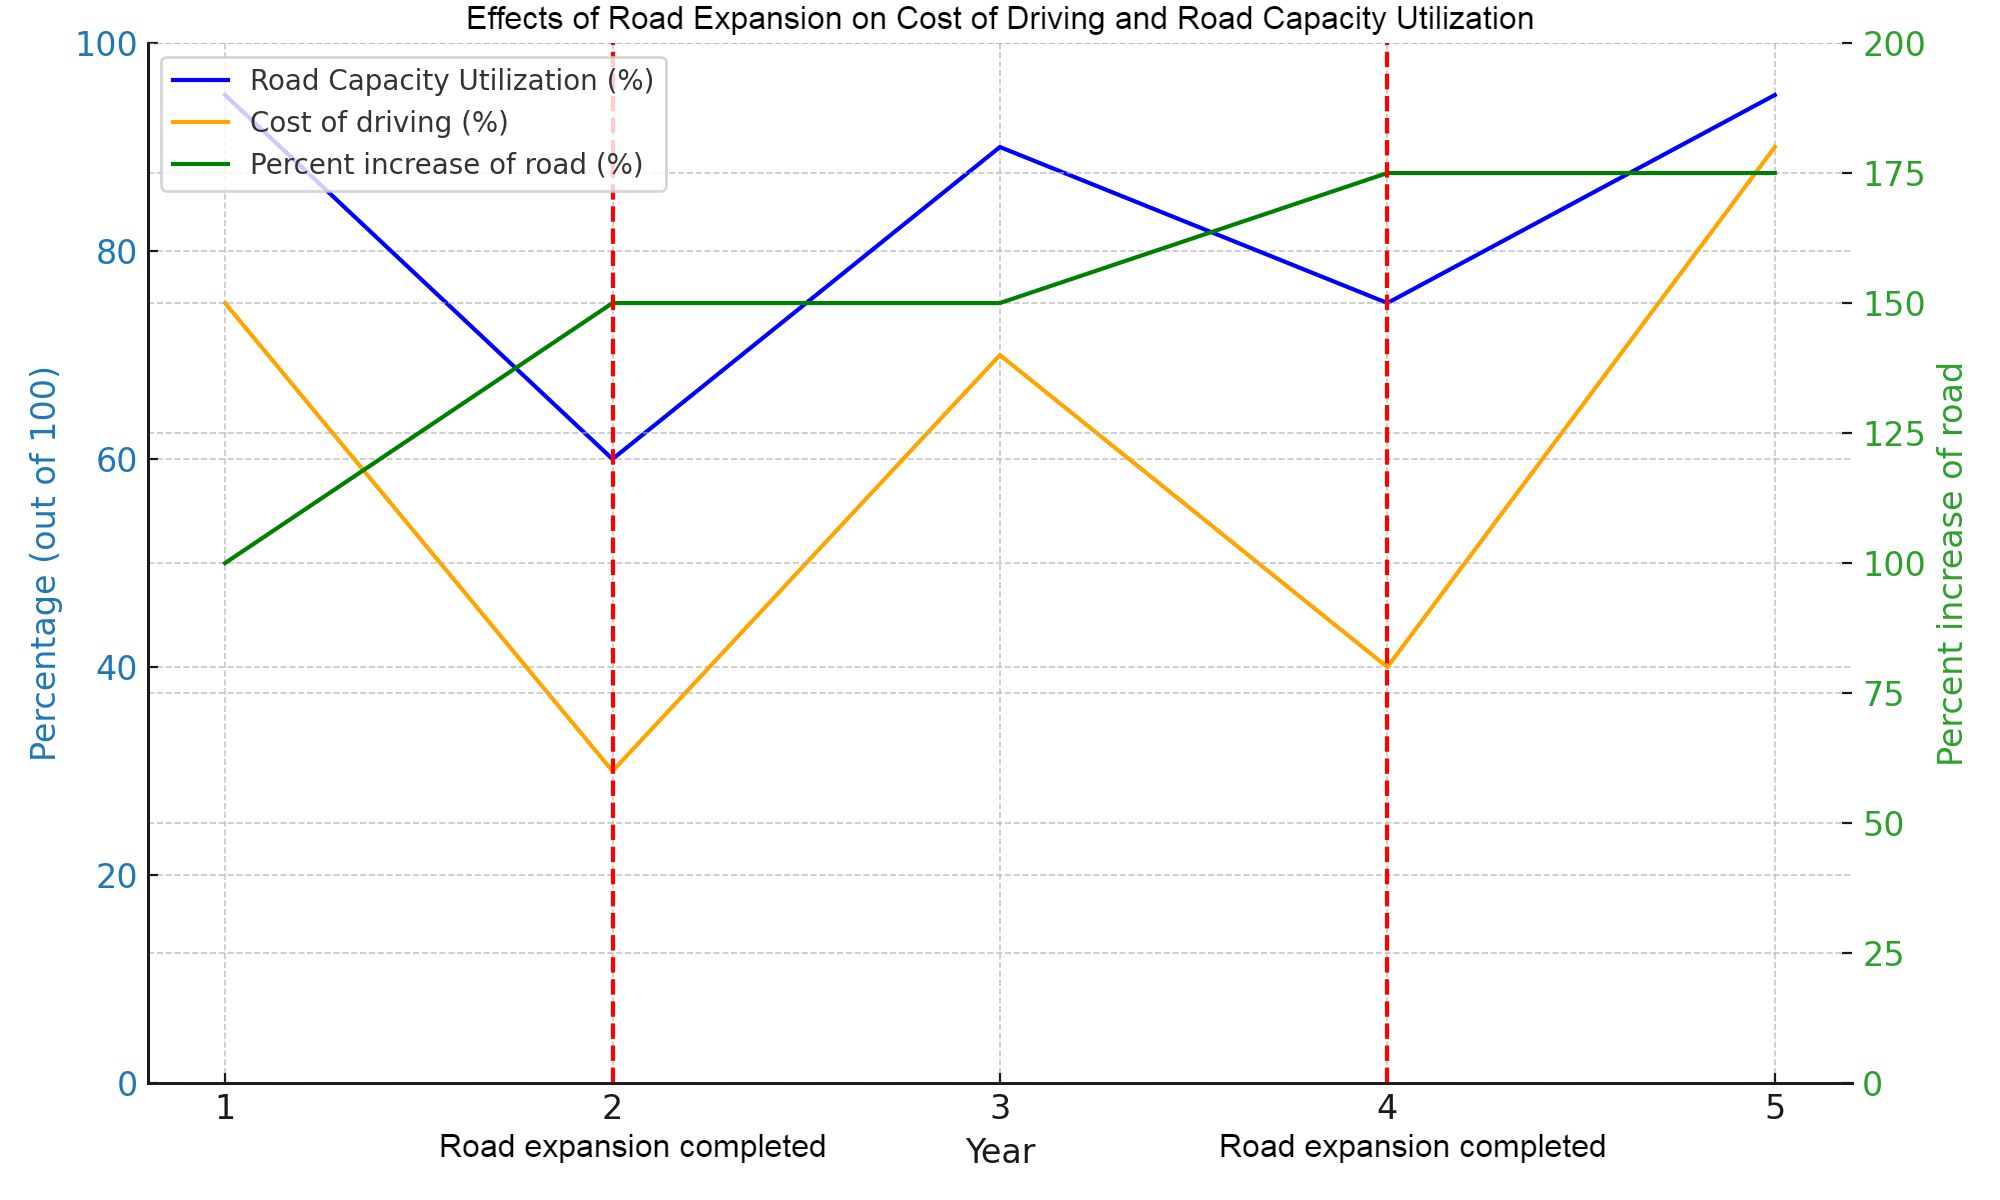
This graph shows a hypothetical road network over the course of five years. Over those five years, the road network receives two “upgrades” where it is either widened or otherwise added to. This is represented by the “Percent increase of road” (green line). The “Road Capacity Utilization” (blue line) and the “Cost of driving” in terms of time, comfort, etc. (orange line) are both compared to their respective maximums and are represented as percentages out of 100. We can see in this hypothetical scenario that although the initial result of the roadway expansion is less congestion, the lower cost of driving attracts new drivers and over time road capacity utilization returns to a higher level.
Where Do They All Come From
I paint a picture above of people crawling out of the woodwork to congest our roads and ruin our lives, but in reality, they are commuters and shoppers who regularly choose to take other routes and/or leave at different times than the peak to avoid the traffic. They are the people we talked about earlier with lower thresholds. Often, they are also new people brought by the development afforded by the increased road capacity. Here are a few reasons for the increase in traffic:
New commuters. As we talked about above, when more road space becomes available, people who previously avoided using certain congested roads may now decide to start using them.
People who shifted from other modes of transportation. People who used to travel by public transportation, biking, walking, or other non-car modes might switch to driving because of the perceived convenience that comes with less crowded roads.
People choosing longer trips. With the roads less congested, people might opt to take longer trips, travel at peak times, or take a “drive out into the country” that they wouldn’t have considered before, increasing the overall volume of traffic.
People moving further away from downtown. Easier commuting due to expanded roadways may lead to increased development and sprawl, attracting more people to live further away from city centers and thereby causing more traffic over time.
Examples of Induced Demand
We already talked about the Katy freeway. That is one of the best-known examples of induced demand. Other examples include Los Angeles, where they have continuously expanded their freeway system since the 1940s in hopes of relieving congestion. They still have some of the worst traffic in the United States. A study by the University of California, Berkeley found that for every 1% increase in freeway lane miles, traffic increases by 0.9% in the long term.
On the other hand, there are rather famous counterexamples. The city of Seoul, South Korea, removed a major downtown freeway and replaced it with a river and recreation space. Instead of resulting in a traffic nightmare, traffic conditions did not deteriorate and even improved in some areas, demonstrating how reducing road space can sometimes lead to a decrease in traffic (a phenomenon known as "disappearing traffic" or "traffic evaporation").

Cheonggyecheon in 2002 (left) before highway removal and again in 2023 (right) after highway removal.
Furthermore, London, England, introduced a congestion charge. This is essentially a toll for driving in the city center and resulted in a significant reduction in traffic and an increase in cycling and public transport use. This is an example of increasing the cost to people that we mentioned earlier in a monetary way and shows how managing demand can be more effective than trying to increase supply.
Now that we’ve covered induced demand, stay tuned: Next week, I’ll discuss how this all might affect traffic after the interchange mandated by the state of Ohio is put in between Strongsville and Brunswick.


Justin Boey writes at Local Urbanism. By day, he works as a software developer; by moonlight, he’s an avid nerd of all things cities and urban spaces. Boey is the Local Conversation leader for Brunswick Strong Towns, a local group dedicated to promoting walkability, community, smart development, and financial strength in Brunswick, Ohio. If you live in the Brunswick area and would like to help, consider joining the Brunswick Strong Towns Facebook page.
On Ash Wednesday, 1966, a highway carved up New Orleans, taking families, flowers, and futures with it. Today, the attempts to rectify those wrongs stop short of actually treating the wound.