Beyond Housing Booms and Busts

.avif)
In the years leading up to the 2008 financial crisis, America built a lot of housing. We built more new homes than we added new households — by a fairly sizable margin — even as home prices rose to levels that increasingly strained household incomes. Then the market broke.
What followed was devastating for the housing industry, with builders and developers going out of business, banks failing and skilled workers leaving the trades for other kinds of work. The capacity to build housing in this country contracted dramatically. And then, after building more housing than we needed in the years leading up to the crash, we spent the years following the crash building far less than we needed.
Kevin Erdmann thinks there is a contradiction here.
In a response to my recent article on housing filtering, Erdmann points to this sequence as evidence that something about my argument doesn't add up. I have argued that we overbuilt housing in the years leading up to the financial crisis. I have also argued, most recently in "Escaping the Housing Trap," that our housing finance system resists the kind of sustained decline in prices that would make housing broadly more affordable, the kind that would come from building our way out of an affordability crisis.
Erdmann characterizes the latter as an argument about the “powers that be,” as if there is some group of powerful people conspiring to keep housing prices high. He calls the apparent contradiction with the 2008 price crash “absurd.”
There is no conspiracy in my argument. There doesn't need to be one.
The modern housing finance system provides abundant capital when housing prices are rising and pulls back that capital when prices fall. This is an emergent property of a system that, over the decades since World War II, has become increasingly centralized and financialized. Housing finance in 1926 was much more locally intermediated and responsive to local conditions. A century later, housing finance operates through institutions and secondary markets that respond to falling prices in very different ways.
This is what happened in 2008. As the housing market turned, construction began falling, prices weakened, credit tightened and the financial system seized up. The response that followed was not a housing market allowed to settle into a long period of lower, stagnant prices while production continued. Instead, housing prices soon began another long ascent, ultimately surpassing the levels reached during the subprime bubble.
That isn't a contradiction in the argument I make in "Escaping the Housing Trap." It is the argument.
What Are We Actually Measuring?
In Erdmann's article, he includes a chart showing annual housing completions as a percentage of the existing housing stock. The chart peaks in the early 1970s and then trends downward, making the housing production of the 2000s look modest by comparison. Erdmann uses this to argue that the idea we overbuilt housing during the bubble years is mistaken, pointing to what he sees as ridiculous arguments along the way.
The chart doesn’t say what he suggests it says.
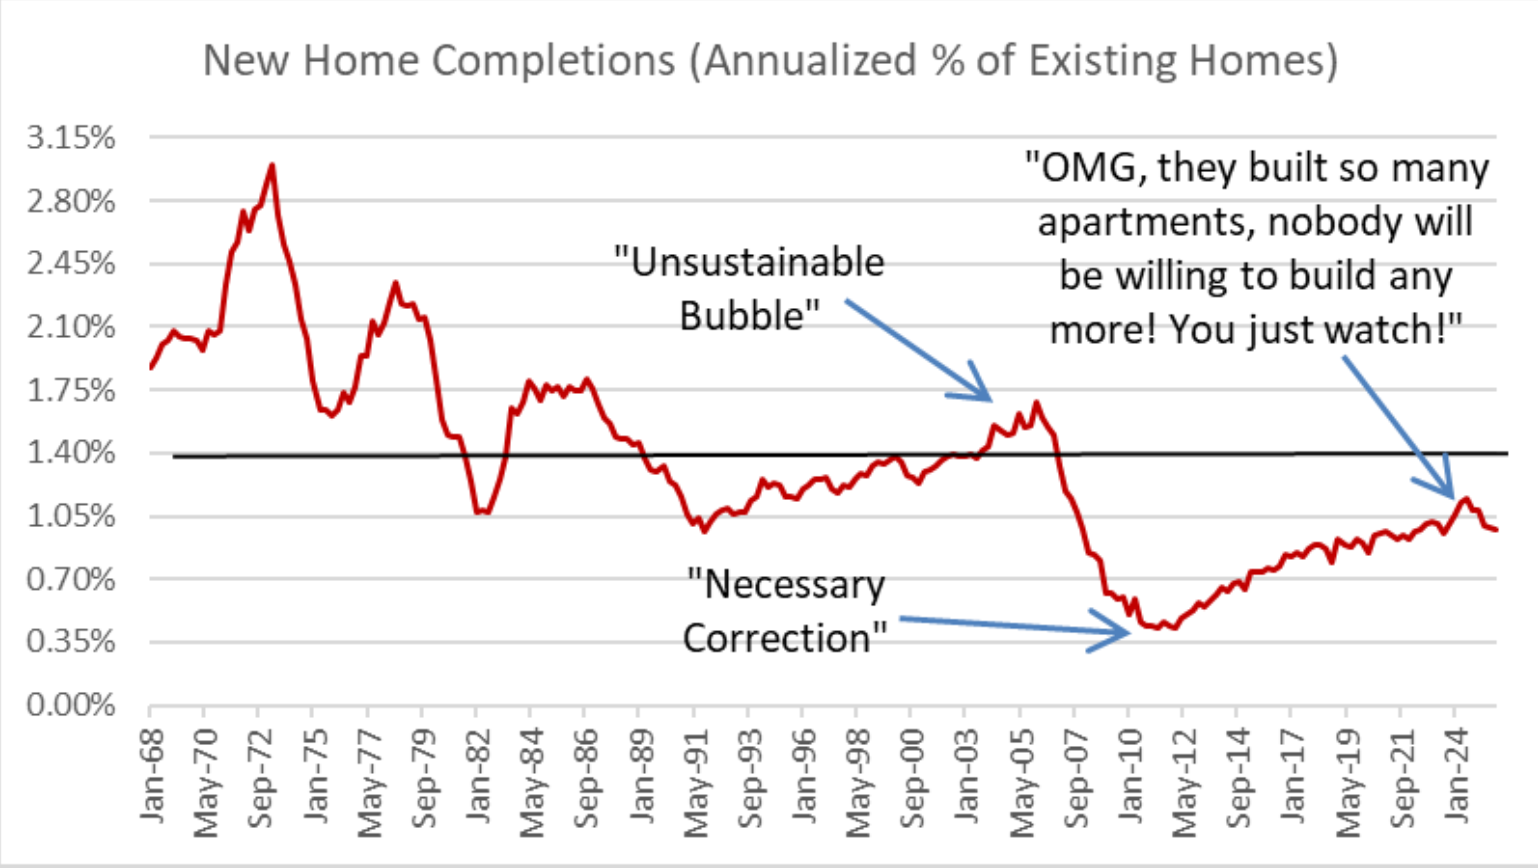
This is the kind of calculation I continually warn our team to be careful with. The numerator is flow, the amount of housing units built in a certain year. The denominator is a stock, an accumulation of the total number of units. At a glance, it tells a story that many want to believe. Upon deeper examination, it obfuscates reality.
Every year we build housing, the denominator gets larger. That means the number of homes we need to build just to maintain the same percentage also gets larger, regardless of whether the number of new households needing those homes is growing at the same rate. A country with 50 million homes and a country with 150 million homes would need dramatically different levels of construction to produce the same number on Erdmann's chart, even if both were adding exactly the same number of new households.
For those who don’t see math this clearly, let me provide an analogy.
Think about how a child grows. A newborn starts out tiny and then gains an extraordinary amount of weight during the first year of life. That rate of growth slows during early childhood, picks up again during the adolescent growth spurt, and then slows dramatically as the child approaches adulthood. If we plotted the pounds of body mass added each year, we would see that familiar pattern. There would be rapid growth early, continued growth throughout childhood, another surge around puberty, and then a tapering as the child reaches their adult size.
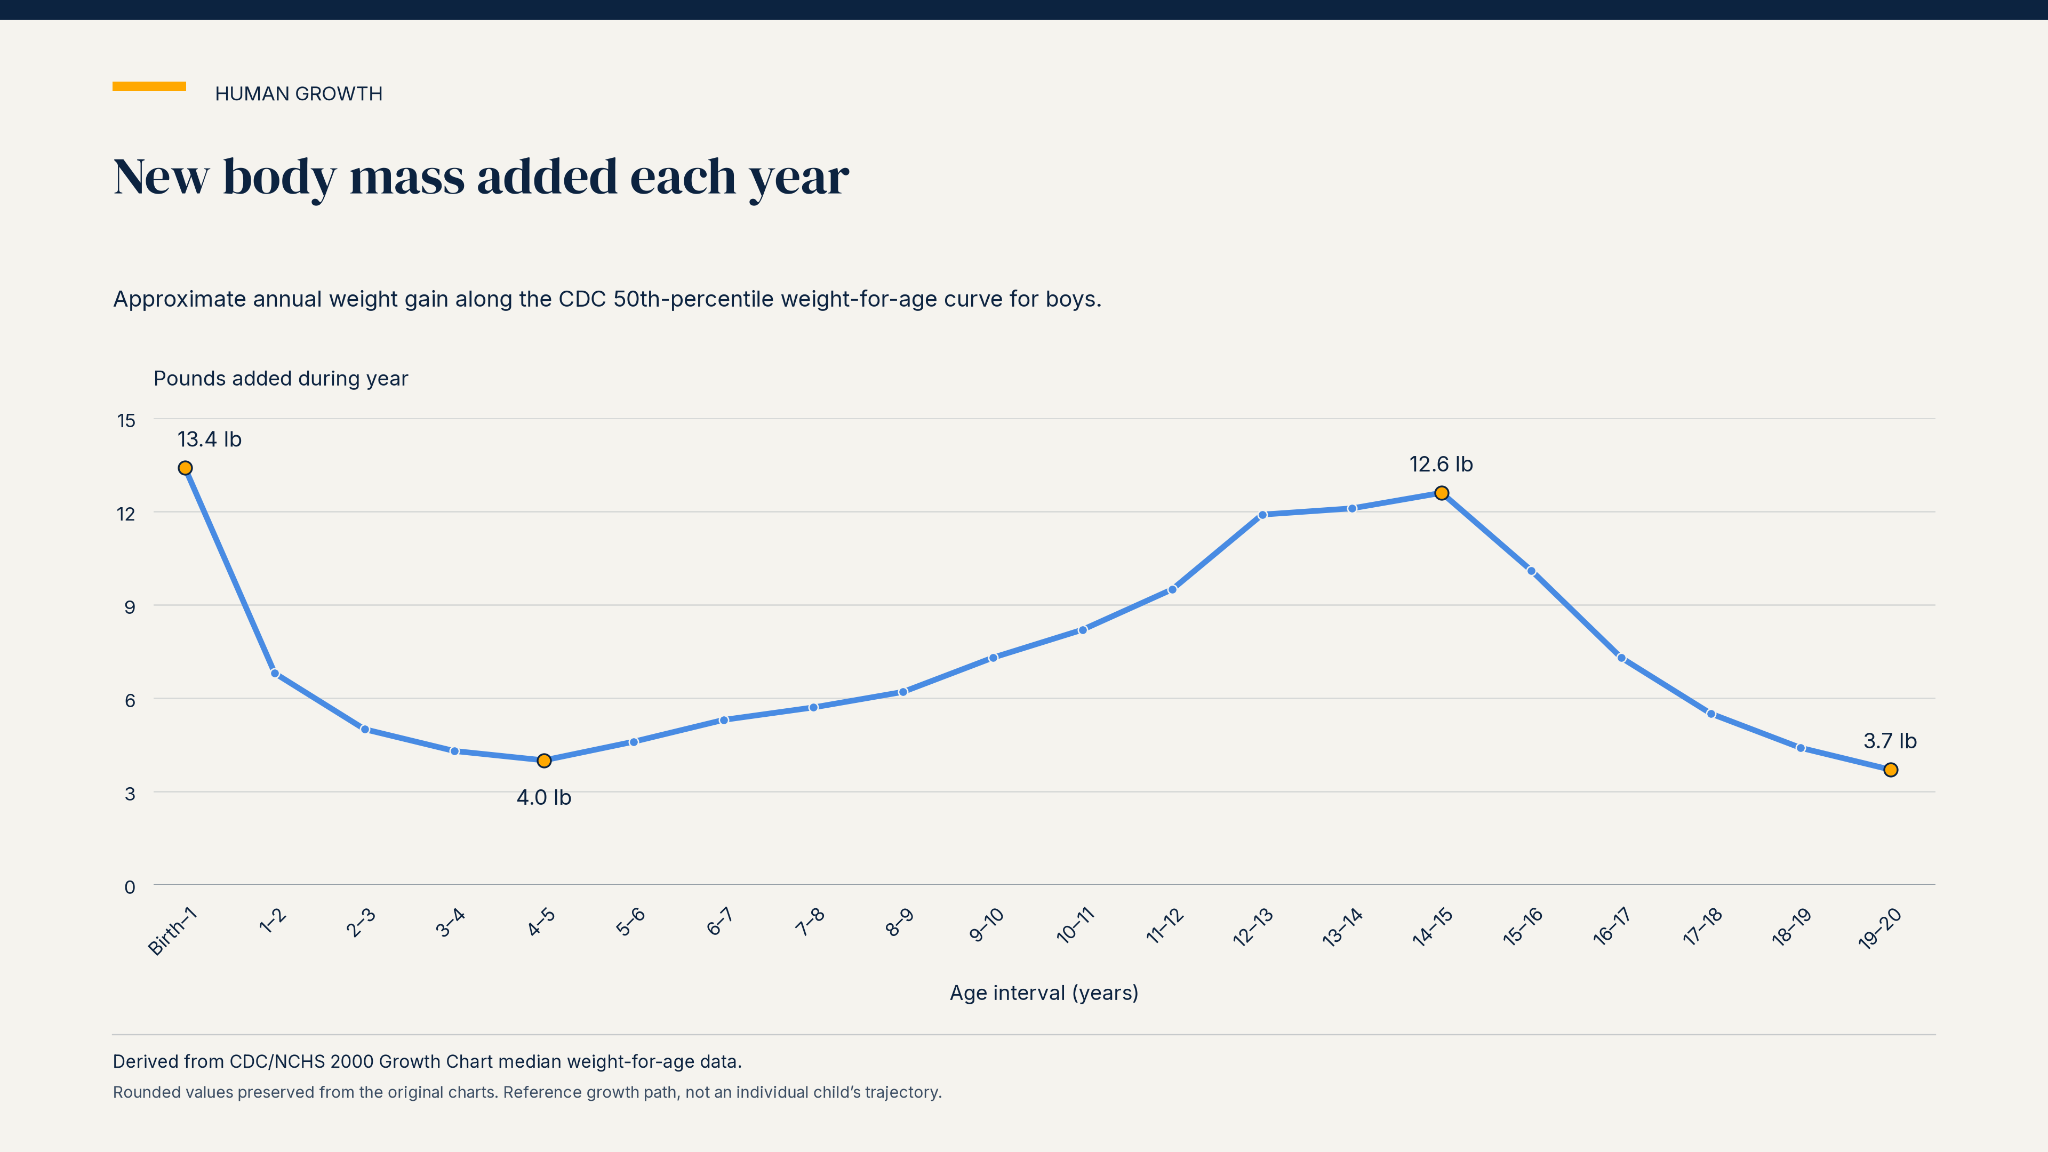
This is very normal. There is nothing mysterious about it. A healthy 16-year-old doesn't need to add weight at the same rate as a healthy 2-year-old. The amount of growth appropriate at any point depends on where that person is in the maturing process.
Now, let's chart the exact same child the way Erdmann charts housing production. Instead of showing how many pounds the child adds each year, we'll divide those new pounds by the child's total existing body weight.
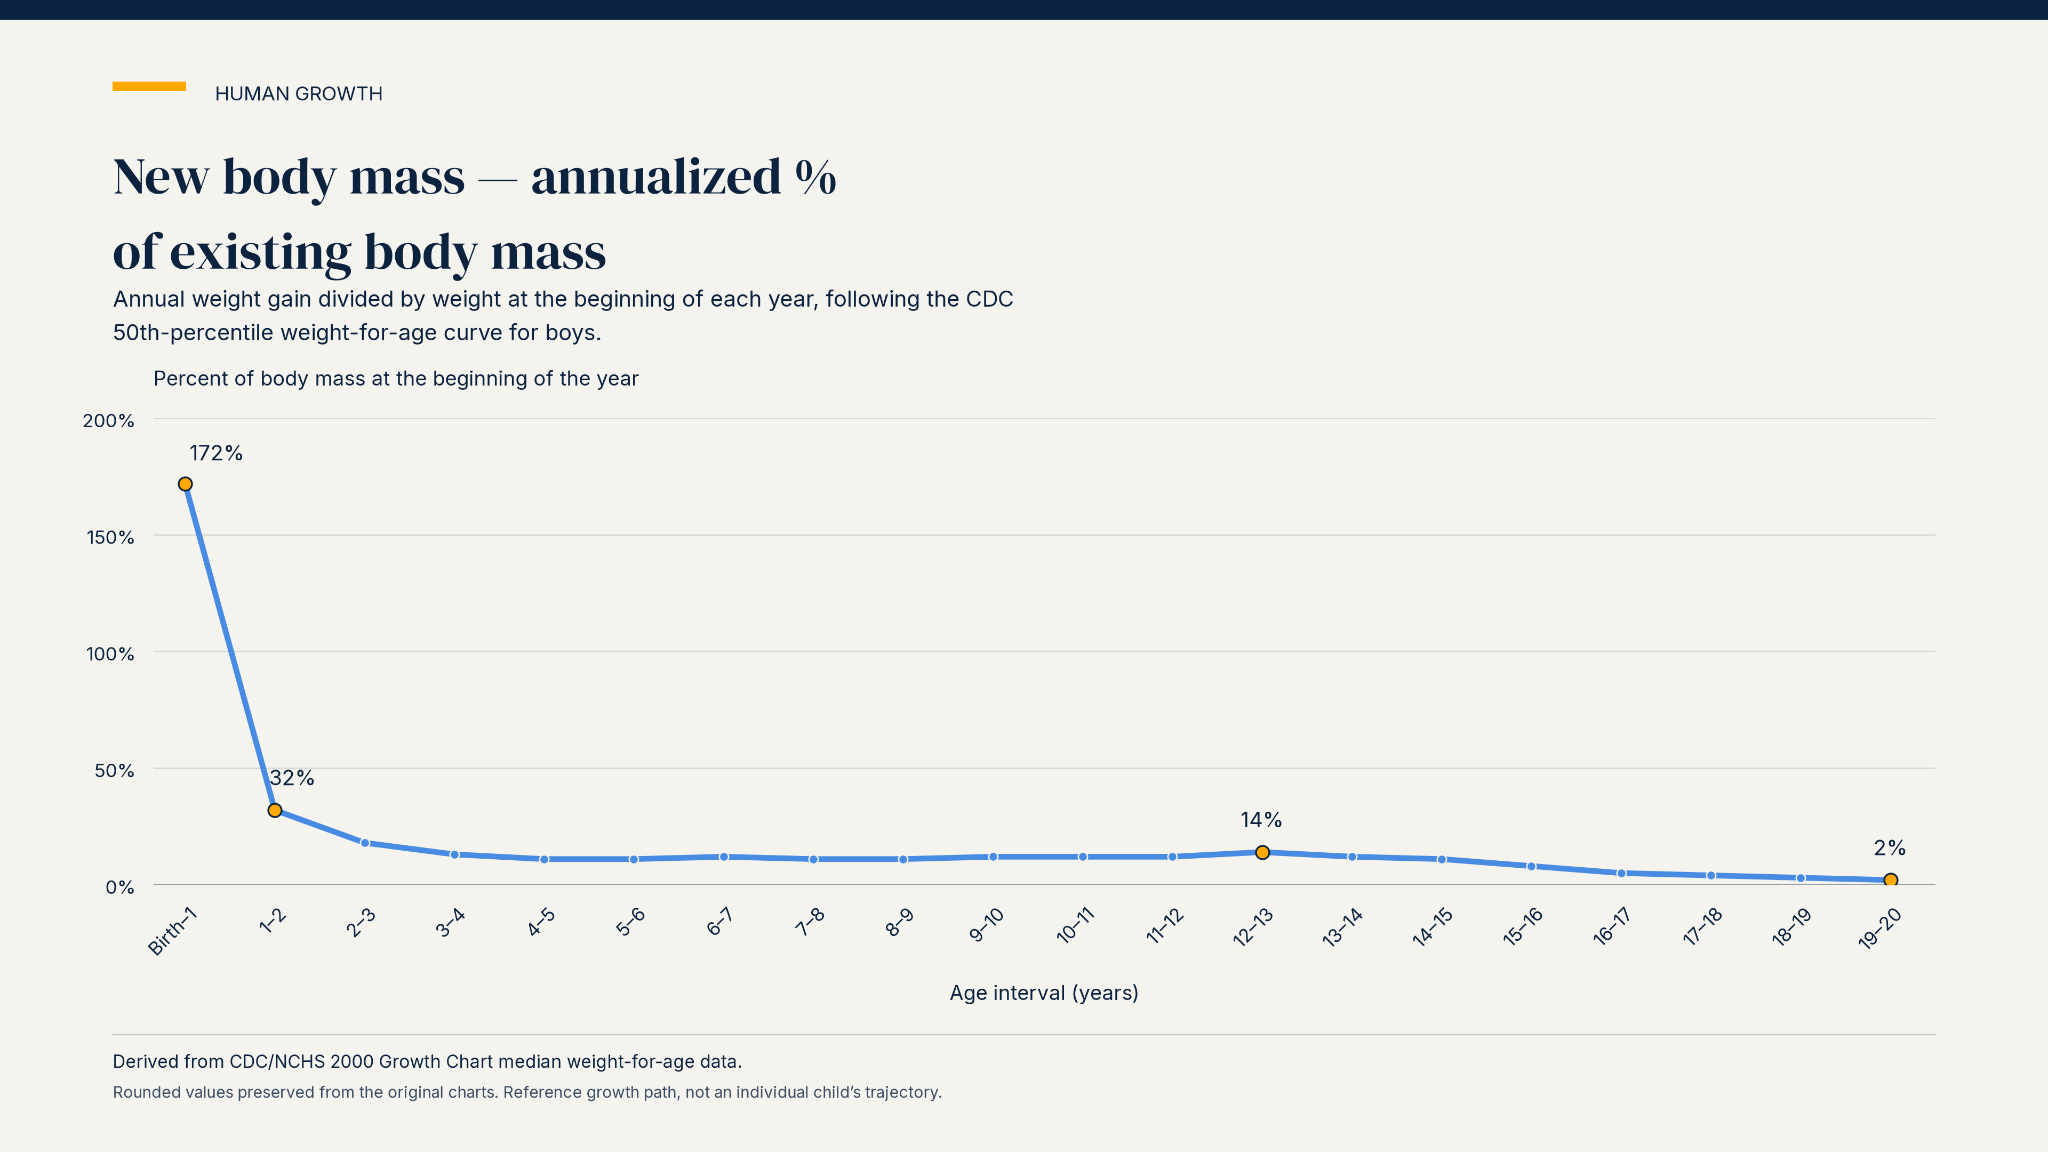
Suddenly, the story looks very different. Growth is enormous at the beginning and then appears to collapse. Even the adolescent growth spurt looks comparatively modest because those additional pounds are being divided by a much larger body. Nothing bad happened to the child or their development. We merely changed the denominator.
This is exactly what Erdmann's housing chart does. The United States of the early 1970s — just starting the second generation of suburban expansion — had a much smaller accumulated housing stock than the United States of the 2000s. We have since matured. Mature systems do not grow at the same percentage rate as young ones. Dividing each year's new construction by everything that had already been built creates a strong downward tendency, one that Erdmann suggests is lost production capacity before we have even asked how much new housing the country actually needed.
Here’s what this looks like when it is applied to automobiles, with the first showing total new vehicles sold and the second that amount divided by the accumulated stock of all registered vehicles. We have far more new vehicles on the road per year today than we did in the 1970s (top chart), but the Erdmann math (bottom chart) suggests we’ve lost the will and capacity to deliver automobiles.
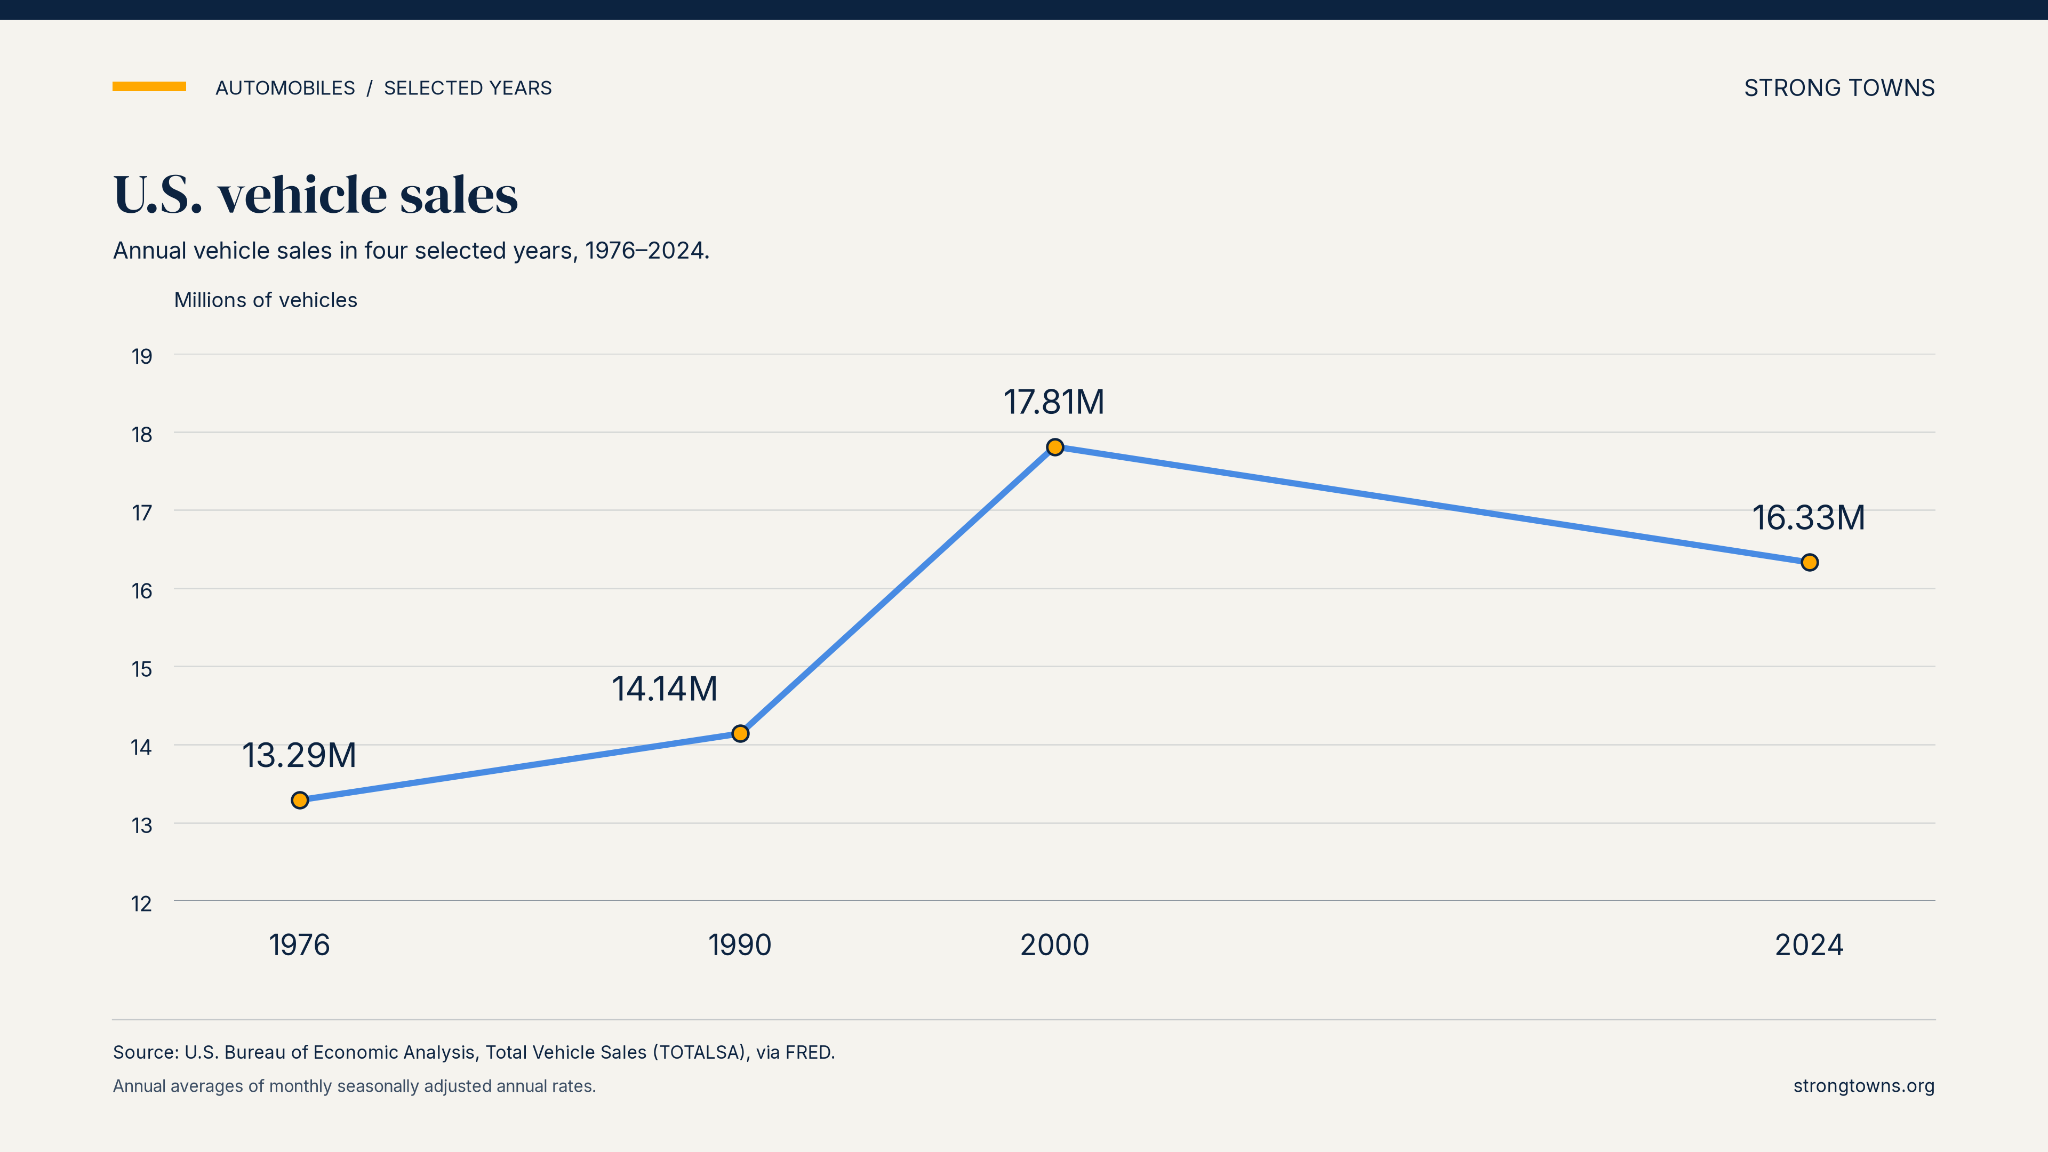
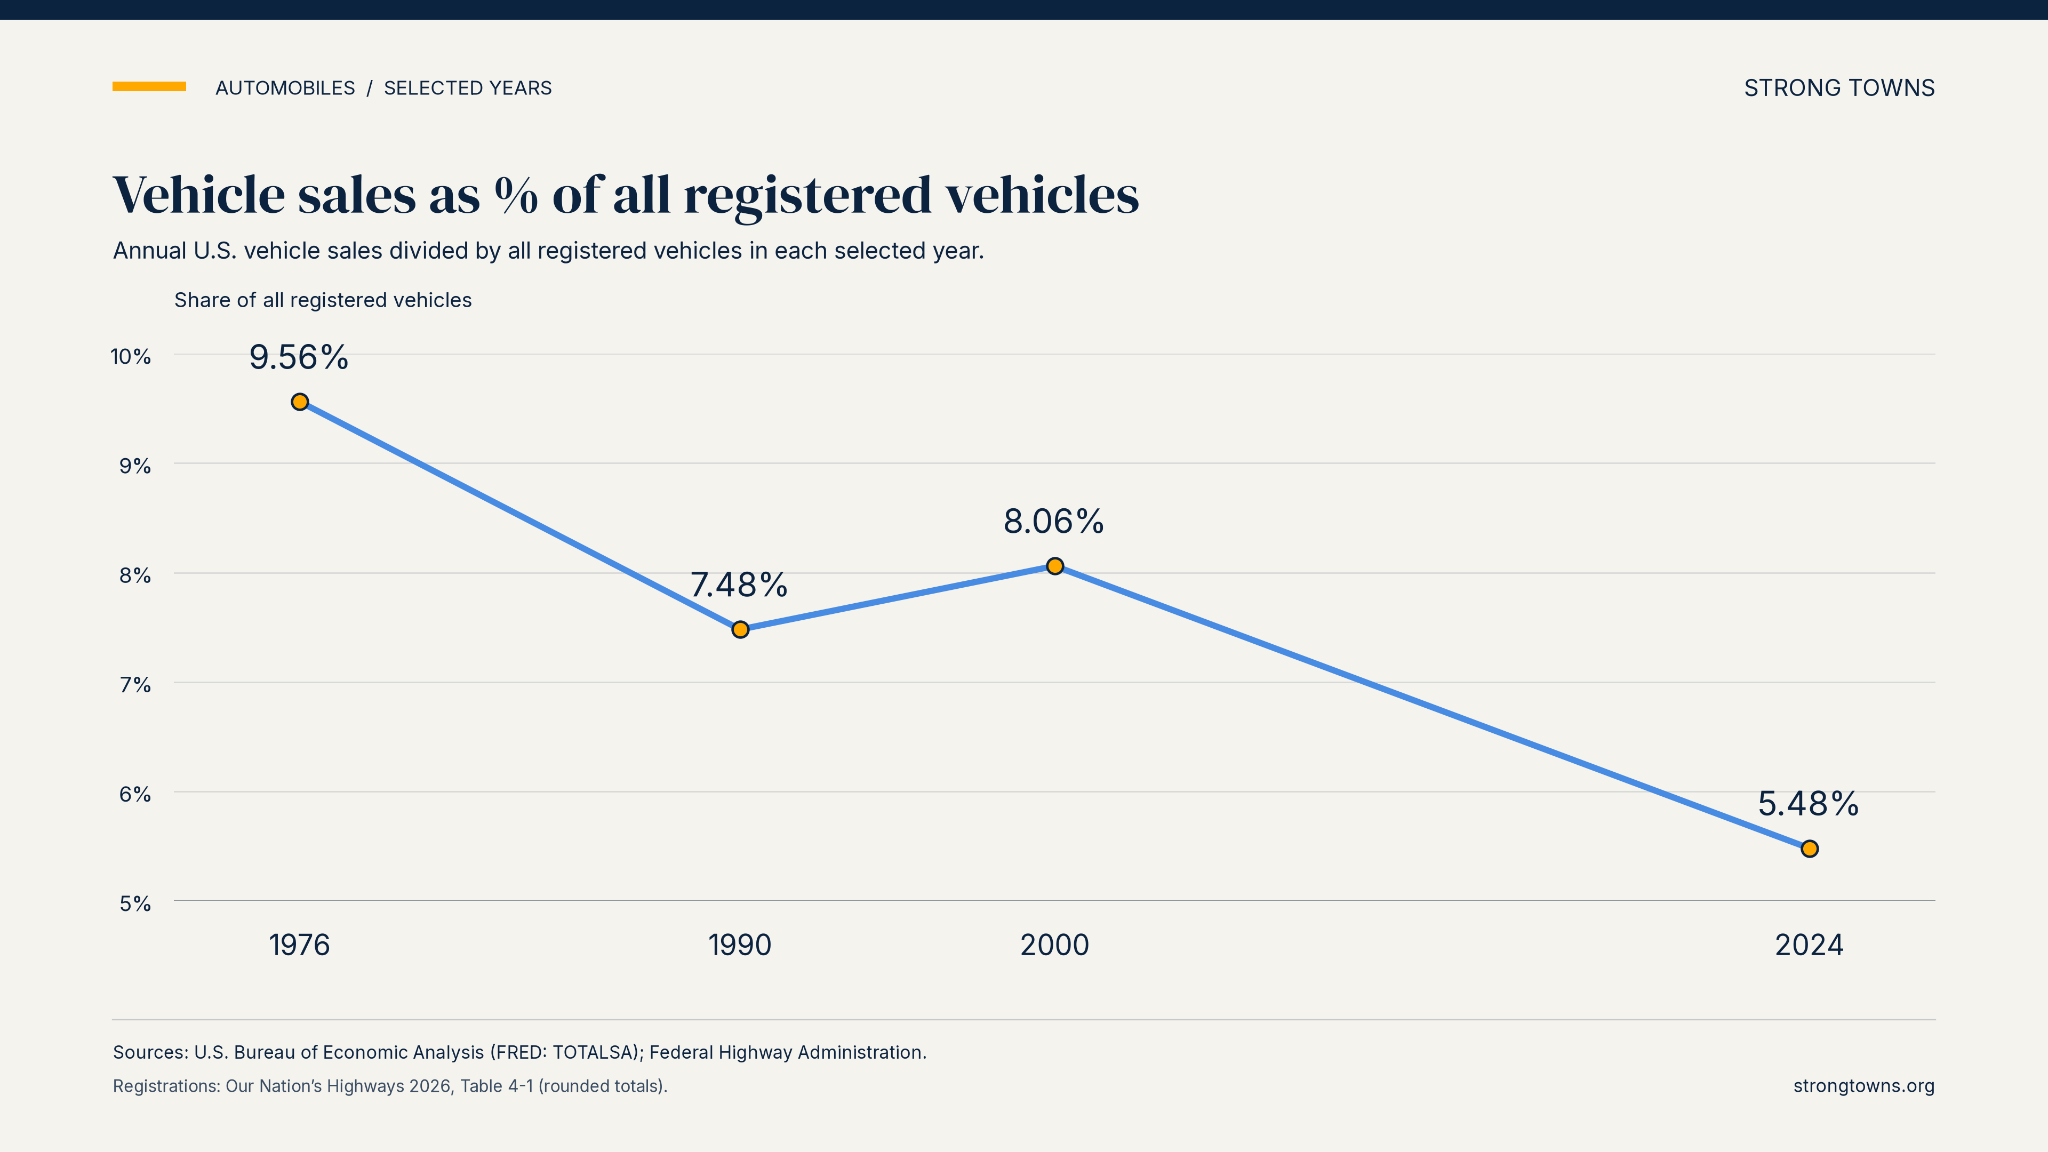
Of course, we haven't lost our capacity to deliver automobiles. We have accumulated a lot of automobiles. As that accumulated stock grows, each year's sales become a smaller percentage of the total, even when annual sales are increasing. The math creates the appearance of decline because each year's sales are being compared with an ever-larger accumulated stock.
With the growing child, we intuitively understand that the appropriate amount of new growth changes as the child matures. With automobiles, the number of new vehicles we need depends on things like how many people are driving, how long existing vehicles last, and how many need to be replaced. We would never determine how many cars Americans need simply by insisting that annual sales remain a constant percentage of every automobile we've accumulated.
Housing is no different. If we want to know whether we were overbuilding housing in the years leading up to 2008, we need some measure of the demand those additional units were being built to serve. The most obvious place to start is household formation.
You Can't Separate the Boom From the Bust
When we compare the number of new housing units to the number of new households, the story Erdmann's national housing chart tells about the 2000s disappears.
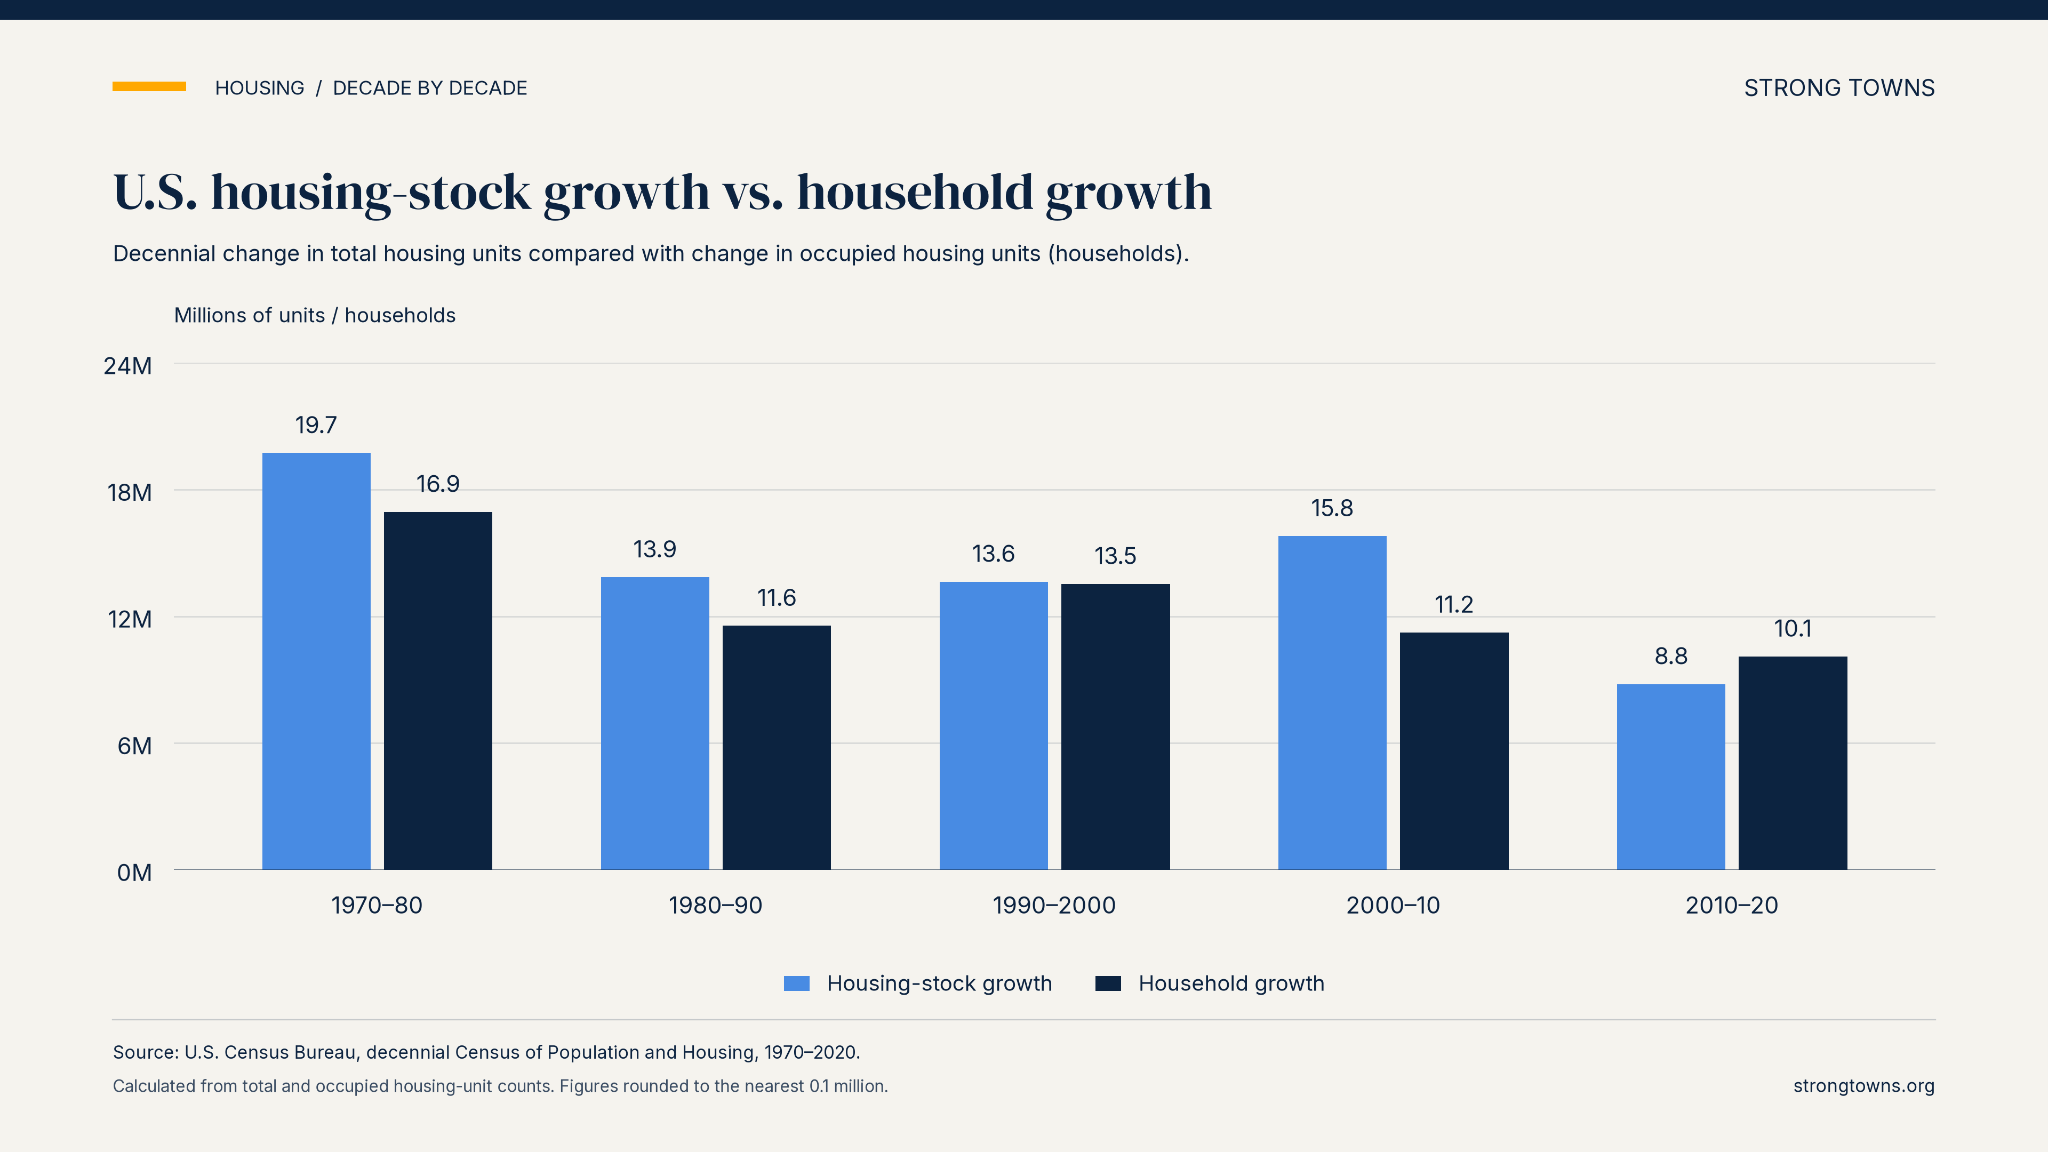
The surge in housing production during the 1970s corresponded with a surge in household formation. America was building a lot of housing because we were adding a lot of households. By the 2000s, those two things had become disconnected. We continued producing housing at a high rate even as household formation slowed, creating millions more housing units than new households to occupy them.
This was not some obscure imbalance that became visible only after the financial crisis. By 2006, inventories of unsold homes were rising sharply and builders were cutting construction. The Federal Reserve described the market as coming off a multiyear boom in both construction and prices, and later acknowledged that increasingly lax mortgage lending had pushed up housing demand, prices and construction. Whatever disagreement we may have about why it happened or what policymakers should have done next, there was an obvious excess of housing production relative to the households being formed.
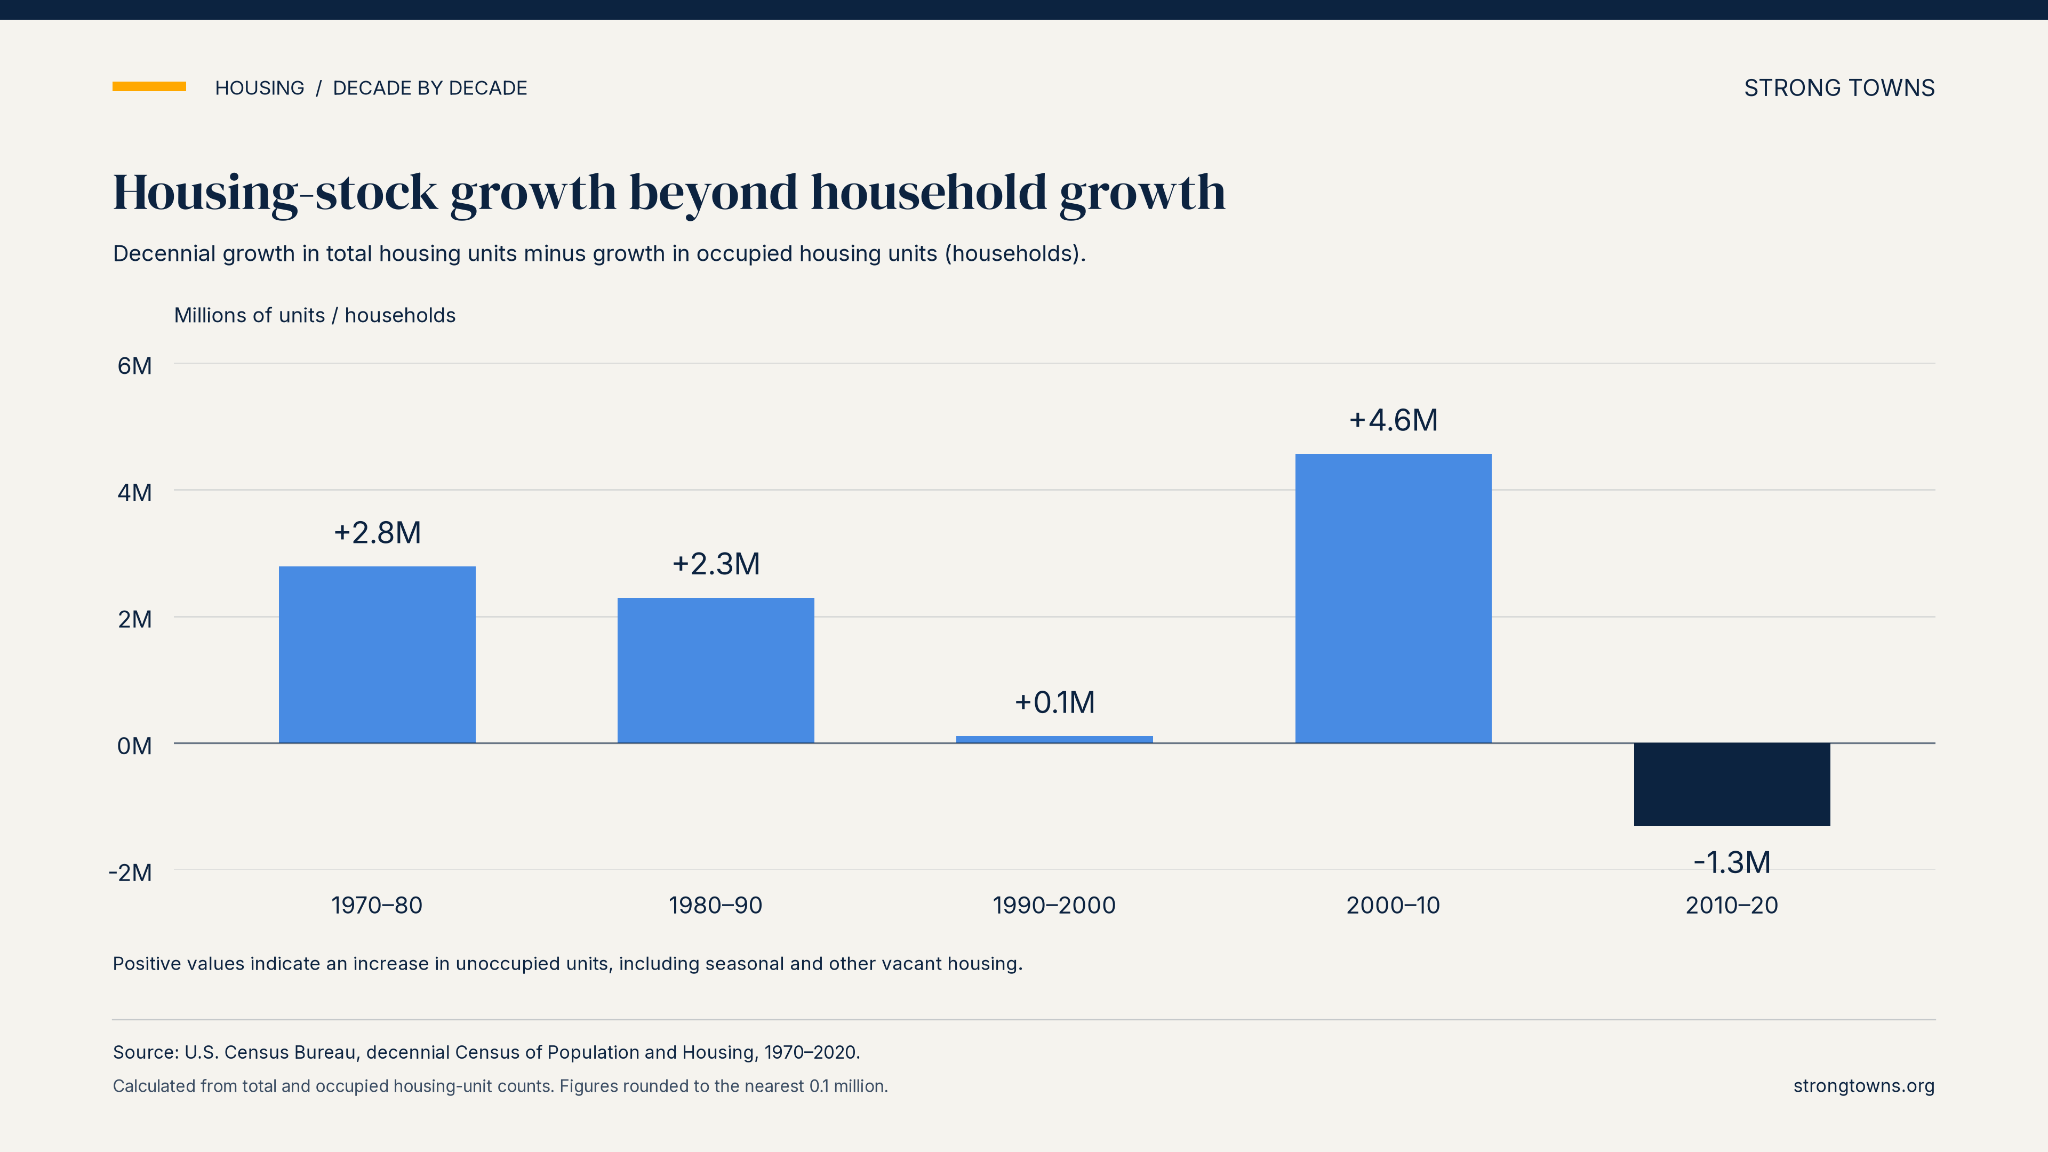
This doesn't mean there was too much housing everywhere. Erdmann is right to emphasize the geography of housing scarcity, especially in what he calls “Closed Access” cities, where people seeking opportunity encountered severe constraints on housing supply. A national comparison cannot tell us whether housing was being built in the places, at the prices, or in the forms people wanted.
There the national comparison matters because the system financing all of this housing is itself national. California does not have one federal funds rate while Minnesota has another. There isn't a separate 10-year Treasury yield for Texas, a separate Fannie Mae for Florida, or a distinct market for mortgage-backed securities in New York and San Francisco. We have increasingly centralized housing finance into a national, standardized system and then asked that system to respond to housing markets that are intensely local.
That guarantees a certain amount of mismatch. The same financial conditions that may be inadequate for a severely constrained market like San Francisco can pour excessive capital into places where housing is relatively easy to build. When national credit conditions tighten, they tighten in both places. When they loosen, they loosen in both places. A one-size-fits-all financial system is necessarily going to be a blunt instrument, creating very different outcomes in different local markets and, at times, amplifying regional booms and busts.
Erdmann's distorted chart is itself a national statistic offered as evidence that America was not overbuilding. Yet, at the national level, we were adding housing substantially faster than we were adding households in a market that was clearly overheating. Erdmann’s underbuilding argument is not supported by a plain presentation of the data.
Erdmann and I do agree on something important about what happened next: the collapse destroyed a huge amount of housing-production capacity. Builders and developers failed, banks pulled back, skilled workers left the industry, and the businesses, relationships, financing channels and supply chains that had taken decades to assemble were dismantled in a matter of years. When demand returned, that capacity was no longer sitting there waiting to be switched back on.
Where we differ is in what that destruction tells us about the system that preceded it.
Erdmann sees a productive housing system that policymakers unnecessarily crushed. I see a productive capacity that had grown inside a financial environment that was itself unstable. Housing production was running ahead of household formation, prices were rising rapidly, mortgage standards had loosened, and enormous amounts of capital continued flowing into the sector. When sales weakened, inventories rose, credit tightened and prices began to fall, construction contracted sharply. Policy choices may well have intensified that collapse, but they did not create the underlying dependence on rising prices and abundant credit.
I don't dispute that we would be better off today if thousands of builders, developers, lenders, subcontractors and skilled tradespeople had survived the crisis. Nor do I dispute that preserving more of that capacity would have allowed us to build more housing afterward. Where I seem to part ways with Erdmann is the assumption that this productive capacity could have simply been preserved as the financial conditions supporting it unwound.
The capacity was not independent of the boom. It was, at least in part, a product of it.
Consider the same disagreement through the framework of the Great Depression. The collapse of the 1930s destroyed enormous amounts of productive capacity as businesses went bankrupt, banks failed, factories closed and millions of people were thrown out of work. The country emerged from the worst years of the Depression with less of the productive ecosystem it had spent the prior decades building. There is no doubt we would have been wealthier if that capacity could somehow have survived.
But it would be strange to look at that destruction and conclude, from the destruction alone, that the economic conditions of the Roaring Twenties had therefore been sustainable.
The economic activity of the 1920s was not independent of the speculative financial conditions that sustained it. Easy credit, rapidly rising asset values, and the expectation that those values would continue to rise fueled enormous amounts of investment and economic activity. We can't assume all of that activity was sustainable and then treat the collapse as some unrelated event that unfortunately interrupted it. Some of that productive capacity existed at the scale it did precisely because the speculative boom made it profitable.
I see the 2000s housing boom in much the same way. The extraordinary productive capacity of the early 2000s was responding to a financial environment that made housing unusually attractive to build. Rising home prices increased collateral values, abundant credit made it easier for buyers and developers to borrow, and those conditions reinforced one another as more capital flowed into the market. The production was real, but it was being sustained by returns that depended on the continuation of the boom.
Then prices stopped rising. At that point, there was no policy lever capable of simply preserving all of the productive capacity while allowing housing prices to fall to broadly affordable levels. The same financial system that had supplied enormous amounts of capital on the way up withdrew capital on the way down. That’s consistent with the financial adage that the markets take the stairs on the way up and the elevator on the way down.
Erdmann finds contradiction in the fact that I was critical of both the housing bubble and the government interventions that followed its collapse. I don't see the contradiction. My criticism of the bubble was that the financial system was behaving recklessly, pouring enormous amounts of capital into development patterns that could not be sustained. My criticism of the response, particularly the push for massive infrastructure stimulus, was that we were committing public resources to trying to restore those same unsustainable patterns.
Those are not opposing positions. They are the same critique applied to different stages of the same financial cycle.
That leaves us with a question that I think is much more important than whether we should have built another million homes in 2006: What kind of housing system can continue producing homes where they are needed, regardless of whether prices are rising or falling?
A Housing Market That Can Find Its Balance
It seems like Erdmann and I ultimately want much the same thing: a housing market where supply and demand can come into balance at price points people can afford. We both look at the years following 2008 and see the enormous damage caused by losing builders, lenders, skilled tradespeople and all the other capacity needed to produce housing.
Where we seem to differ is in what we think that experience teaches us.
Erdmann looks back at the productive capacity of the decades before 2008 and seems to find something we need to restore. I look at the same period and see a system that produced enormous amounts of housing, but only under financial conditions that were not only predatory and reckless, but ultimately proved unsustainable. Maintaining productive capacity is important, but production itself is not the goal. The goal is housing people can afford.
That distinction matters because our goal can't merely be to get housing production back to some historically high level, regardless of how it’s measured. If abundant production eventually reduces scarcity, then prices and returns should fall. A housing system that responds to those falling returns by withdrawing capital and shutting down production will eventually recreate the scarcity it temporarily relieved.
This is why Strong Towns continues to advocate for the expansion of a competing, bottom-up housing ecosystem: many small developers making incremental investments, local financial institutions capable of financing projects based on local conditions instead of the requirements of the national housing finance system, neighborhoods able to adapt gradually, and a development process that allows housing to be built where it is needed, whether or not it appreciates in value and provides investment returns over time.
This is critical for entry-level housing. We need local lenders capable of looking at a modest project, understanding the local market and the people involved, and financing housing that makes sense even when it doesn't fit neatly into the standardized products and secondary markets that dominate housing finance today.
Here’s a chart that tells the simple story.
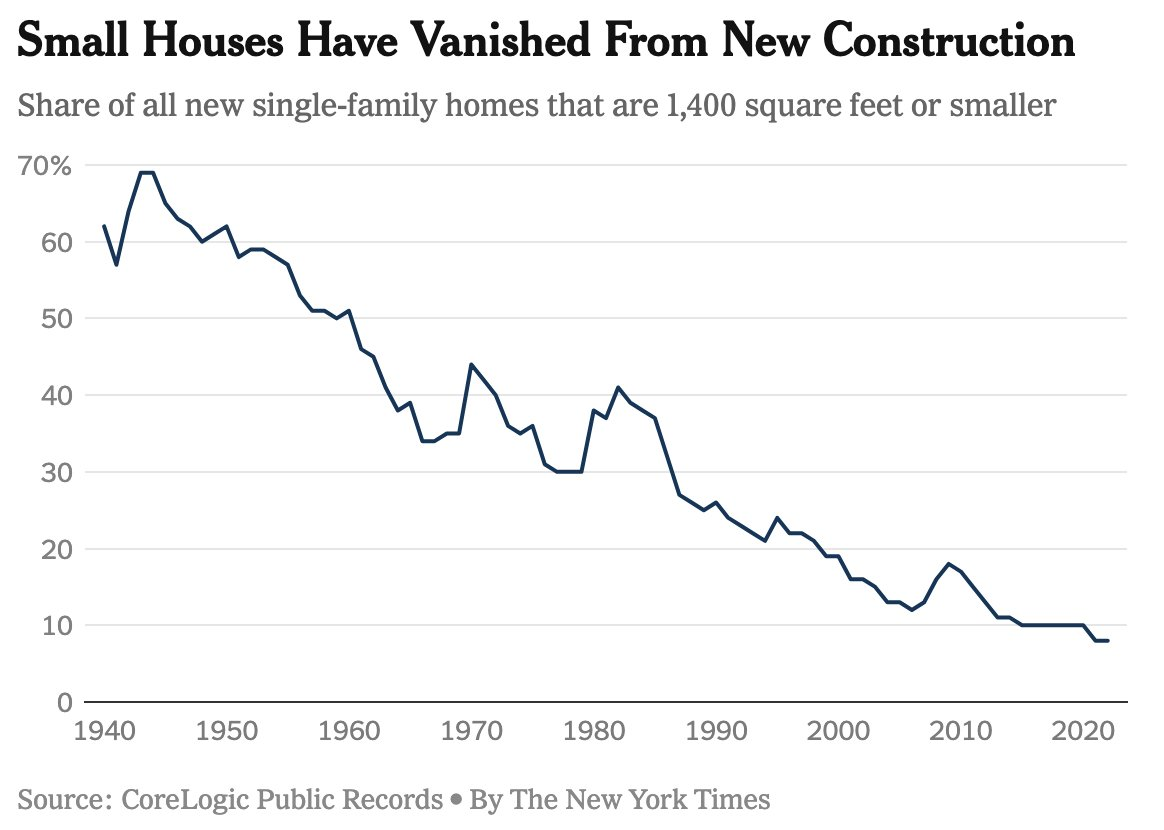
Filtering is part of the process, but filtering is insufficient in a housing system that can produce homes only while prices are rising. The challenge isn't to recreate the housing boom we had before 2008.
It's to build a housing system that doesn't depend on one.
Charles Marohn (known as “Chuck” to friends and colleagues) is the founder and president of Strong Towns and the bestselling author of “Escaping the Housing Trap: The Strong Towns Response to the Housing Crisis.” With decades of experience as a land use planner and civil engineer, Marohn is on a mission to help cities and towns become stronger and more prosperous. He spreads the Strong Towns message through in-person presentations, the Strong Towns Podcast, and his books and articles. In recognition of his efforts and impact, Planetizen named him one of the 15 Most Influential Urbanists of all time in 2017 and 2023.
%20(1).avif)
%20(1).avif)
%20(1).avif)
%20(1).avif)