Good Urbanism Requires Numeracy
.avif)
.avif)
"The preaching of Cassandra." (Source: Wikimedia Commons)
Cassandra was a mythical priestess of the Bronze Age city of Troy, located on the coast of modern-day Turkey. She was the star of a rather cruel game of “would you rather”: always be right but never believed, or always be wrong yet trusted unquestioningly. Cursed of the former by Apollo, she warned her people of war, of Greeks, and of a suspiciously generous wooden horse filled with decidedly ungenerous soldiers. She was right. No one listened. And then she died.
Such is life.
In contemporary discourse around the state of our cities, there are many Cassandras whose dire predictions about what the next decade might hold if we don’t correct our course will, I believe, be proven correct. They’ll be ignored, too, and many will suffer. But the Death and Life of American Cities doesn’t have to follow this path. If our public officials, and the electorate more generally, heed these words, we can successfully form, and steward, the greatest cities the world has ever known. Such is the privilege our extraordinary wealth, knowledge, and technical capacity offer to us. I don’t have much hope for this, however.
Many would-be Cassandras are rooting for decadence to consume our most prosperous cities out of cultural partisanship. This is easy for them to do, perhaps natural, because they do not live in these places. It is far more difficult to know of the glory of the West Side Highway on an early summer evening, or the magnificence of world-class art just a few blocks away in one of several directions, and still say so. Well, I’m a New Yorker who often has occasion to take in the vast cultural amenities advertised by this city, and I am telling you that this is still so. It seems that few, if any, of my neighbors will do the same (while still supporting urbanism, generally). If I am fated to be a Coastal Cassandra, so be it.
New York, San Francisco, and Los Angeles are no more above impermanence than Babylon, Carthage, or Persepolis. If things do not change, they will meet the same fate. There is no divine right to success.
Cold Fronts Ahead
How can I be so confident in my prediction? Well, reading a city’s finances and judging where it’s headed is little different than looking at a weather forecast to gauge if one has to bring a coat for their errands. When it’s 50 degrees, it’s more or less a matter of personal preference. At 0, one might need several. Looking at the forecast ahead, our cities look unmistakably cold.
Let’s start with the basics of how to read this trajectory. Cities collect various forms of taxes, fees, and interest. They also get some aid from their state and federal governments. Add these together, and one arrives at top line revenue, or the maximum budget a city can spend on itself in a given year (theoretically).
Cities spend their budgets on all manner of things; Education, Transportation, Police, Health Insurance, Social Services, etc. Whatever it likes, really, so long as it doesn’t spend money it doesn’t have. So far, so good.
On the surface, growing top line revenues hasn’t been an issue for America’s most prominent cities. The 2010s ushered in broad prosperity for these places. A trend that, while interrupted by the pandemic, seems to have continued apace in the years afterwards. San Francisco’s budget grew by more than 140% from 2010 to 2025. Boston’s doubled. Inflation grew by only half, so these represent enormous real gains in municipal budgets.
This has allowed cities to expand their social missions. In New York, the Department of Education’s budget more than doubled from $18.38 billion in 2010 to $42.8 billion in 2026. With just under 950,000 enrolled, that works out to $45,000 in resources per student, higher than the average cost of college in America. This happened while New York City Public Schools enrollment declined by nearly 150,000 kids, further boosting resources per student. On the west coast, Los Angeles Spent $256 million dollars on its libraries alone last year.
Budgets are healthy, social programs are robustly funded, and fashionable people prefer to spend more of their time in these places than anywhere else. How could the forecast be chilly? Well, frost emerges once we take a deeper look at what’s driving both the top line and expense numbers.
While many cities in the country are statutorily required to balance their budgets, they get considerable help in this objective. New York received $16.6 billion dollars in federal aid in 2021 to shore up its finances in the wake of Covid, representing more than 16% of it’s entire budget. Aid dropped by nearly $5 billion in 2026, shrinking federal funds to just 9% of the budget. These funds are lumpy, and, depending on the administration in Washington, capricious. As such, relying on them to fund one’s programs is a dangerous game.
New York has also gotten help from surging income and various employment-based taxes. In a Review of the Financial Plan of the City of New York, the State’s Comptroller Thomas DiNapoli notes that “for the fifth year in a row, the city collected over $3.5 billion more in city tax levies during the fiscal year than anticipated when the budget was adopted." It’s not possible to sustain record high receipt collection every year. The good times cannot last forever. And yet, we’re spending like this will be the case, even dipping into our rainy day fund.
We cannot responsibly assume a city’s top line receipts will continue growing for a few reasons. Especially not New York. First, the the city has experienced net domestic outmigration for 25 years in a row. These losses were once shored up by immigration, but not anymore. From its peak of 8.8 million in 2019, the city’s population has declined by half a million people. Sunbelt metros with lower costs of living, on the other hand, have grown significantly.
Who can blame those moving? Dallas, a city of 1.3 million, has 1,361 homes for sale under $450,000. New York, more than 6 times the size, has 101. For those keeping score, that’s 85 times the listings per capita.
Zooming out to the metropolitan area, DFW has 17,822 such homes for sale, while an area the size of Taiwan (stretching from Pennsylvania in the West, Tom’s River in the south, the entirety of Long Island and New Haven in the north east, and Poughkeepsie in the north) has 3,201 homes for sale under $450,000. The results get even bleaker when adjusting for homes built since 2010 (only 77).
Compare similar dynamics for Houston, Tampa, Phoenix, Salt Lake City, and Charlotte, and it’s no wonder so many middle class families are choosing to flee expensive coastal metros where the cost of housing relative to income continues to worsen.
Second, fewer residents means lower taxable income. This is principally felt at the extremes. Those who contribute the most tax, and those who receive the most benefits. Effects are both direct and indirect. The 33,500 filers who made more than $1 million in New York in 2021 made 41.9% of the income and paid 46.6% in taxes—a relatively consistent proportion over the last few years.
The bottom 40% of earners pay no taxes, and in fact get paid through refundable credits.
In total, the top 20% of earners pay 78% of taxes. This is exactly how a progressive tax system is meant to work—the rich pay a far higher share than everyone else, disproportionate to income. This mirrors national dynamics, where the top 1% of earners make 22.4% of income and pay 40.4% of all taxes, while the bottom 50% earns 11.5% of income and only pays 3% of total receipts.
This system works so long as higher and middle income households stay in the tax rolls. When the wealthiest leave, there’s less room in the budget to spend on services, as they take their high taxes with them. Far more damaging to how a city is experienced, however, is when the middle class leaves. This hollowing creates a demographic dumbbell where there are a few very high earners, and a multiple of low (or no) income earners, creating isles of prosperity and oceans of precarity. As of 2024, 60% of New York’s population were considered low income. 25% were living below the poverty line. The divide deepens.
This further burdens city budgets as the relative numbers of low-income earners expand. New York and California, the states most impacted by these trends, lost $111 billion and $102 billion in net adjusted gross income throughout the 2010s, respectively, while poverty rates surged. This is not a strictly causal claim, as Covid was the primary accelerant of poverty. Nevertheless, it has resulted in billions of lost potential tax revenue for coastal cities, and a decline in median household incomes. The majority of population losses have come form the middle class, who comprise three-fourths of all movers.
These trends may reverse, as some evidence is pointing to, but it’s tenuous. With the shrinking of middle class households in these states, all the richest need is an incremental tax increase to push them away, and then the tax base is destroyed as they are responsible for nearly all of it. New York is already facing a $4.5 billion gap in its proposed budget for next year.
Mayors across the country are playing a dangerous game seeing how far they can push their primary budget contributors.
Periculosa Obligatio
But this is only part of the problem. Cities don’t just have annual expenses in the form of Police or Transportation budgets. They also have longer term obligations as a part of their Capital Budgets for the construction of schools, infrastructure, and parks, which they fund via debt. This is pretty standard. What’s not standard is how rapidly it’s rising.
If debt service stayed roughly constant as a proportion of the city’s budget, this up-and-to-the-right chart wouldn’t be as scary. But they’ve not. Since 2000, this ratio has risen from 5.5% to nearly 9%.1 This might not seem like a lot, but in absolute terms, it’s an extra $6 billion annually, or 600 million halal cart lunches. If the Capital Budget continues to rise, and interest rates increase (which they are certain to do at some point), this 9% number could very quickly rise higher, pressuring the city’s finances further still.
Thankfully, the city is aware of this issue. In the 2026 Annual Report on Capital Debt and Obligations, Comptroller Lander noted “debt service as a percentage of City tax revenues was 10.2 percent in Fiscal Year 2025, representing a modest decline from the Fiscal Year 2024 and well below the 15.0 percent ceiling that the City uses to evaluate debt affordability.” The city’s usage of debt denominated by tax revenues, as opposed to the entire budget, is conservative. But even by these metrics, however, the Comptroller’s office is projecting to brush up against the debt affordability ceiling by 2033, with expected annual budget shortfalls between $5 billion to $6 billion from 2027 through 2029.
I cannot stress enough that these shortfall projections factor in robust growth of the tax base. How deep will the annual gap get if things go poorly?
Less hopefully still, there’s not much political will in City Hall to do much about it; the current administration seems poised to further entrench this problem. Ratings agencies have noticed. S&P and Moody’s have issued warnings about the city’s finances. If these warnings are acted upon, the city’s bonds will get downgraded, which will make borrowing more expensive, which will exacerbate all of the other problems mentioned, and, eventually, bankrupt New York. The cold front marches closer.
Were that these were the only precarious obligations. New York City has 5 pension funds which support around 800,000 active employees and retired beneficiaries. In 2025, the city budgeted more than $10 billion in pension payments, a nearly 5 fold growth in proportionate spending from just under 2.1% of the city’s budget in 2000.
All is not as it appears, however; Budgeted contributions don’t tell the full story. Parsing through financial reports, one comes across the “Fringe Budgets” line item, defined in the Adopted Budget as “Payments made by the City to cover pensions, health insurance and other benefits to City employees.” So while the budget explicitly called for $10.6 billion in payments in 2025, the city actually spent $11.8 billion towards pensions.2 But wait, there’s more!
Beyond the major 5 pensions, there are several other Employee Benefit Trust Funds & Plans, like the NYC Deferred Compensation Plan for 401ks, Other Post-Employment Benefits for health insurance, The Correction Officers’ Benevolent Association Widows and Children’s Benefit Fund, and The Hotel and Gaming Trades Council Funds.
When factoring in all Pension and Other Employee Benefit Trust Funds, the city spent $15.8 billion in 2025—14% of the entire budget. This is a more than 7x proportionate increase, and 22x absolute increase, on retirement benefits since 2000.
In what seems to be temporary a silver lining, pension contributions have stabilized in recent years due to than expected market returns. When returns are good, the city doesn’t need to chip in to cover the gaps between what was promised to pensioners, and what the investments yielded. Despite these good returns, and the enormous amount the city is contributing, however, the market hasn’t been able to fully allocate for its pensioners.
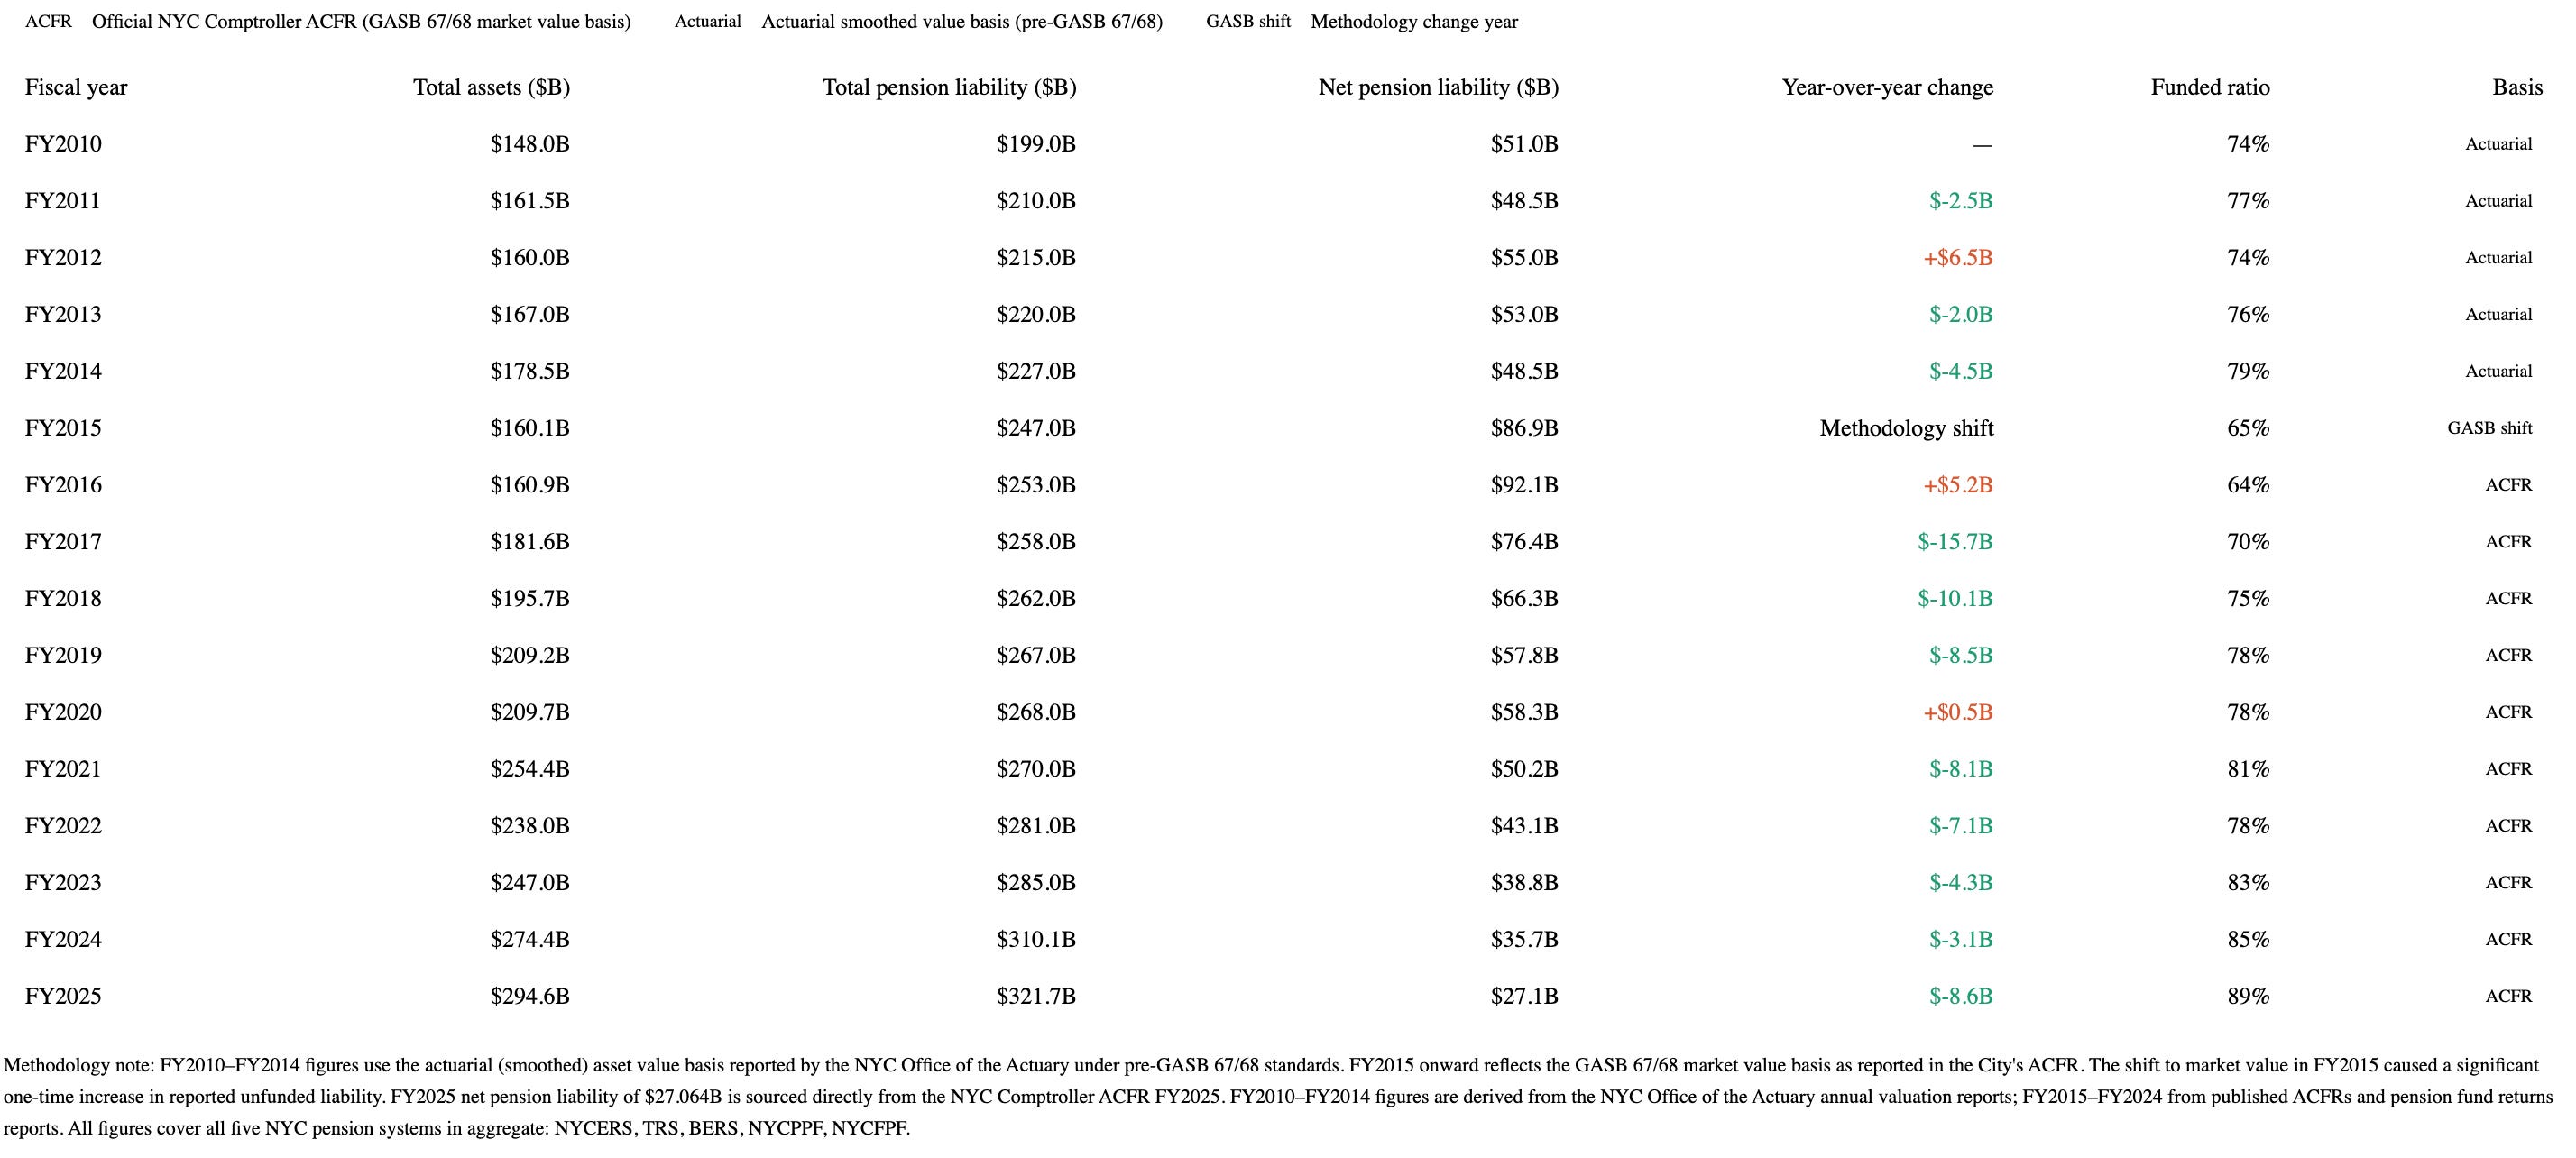
New York’s main pensions held $294.6 billion in assets at the end of Fiscal Year 2025. The city estimates that it’s Total Pension Liability (the present value of promised future retirement benefits for employees) is $321.7 billion. This means they’re only 89% funded, with around $27.1 billion in unfunded liabilities. Surprisingly, this is not terrible by national standards, and has, in fact, been gradually decreasing over the last decade plus.
Chicago, for example, has higher absolute unfunded pension liabilities than 43 states—including $10 billion more than Florida, a place with 20 million more people. Despite having a third of the population of New York, Chicago has double the pension liabilities. To try to compensate for this, Chicago property taxes were doubled in the last decade. 80% of the city’s entire property tax levy now goes towards paying those pensions. Less and less money has been dedicated towards provisioning city services. Anyone who has visited Chicago, or lives there, can feel this fiscal strain intimately.
What’s not good for New York is that the city has more than $100 billion in Unfunded Retiree Health Care Benefits—a different retirement mechanism than pensions. According to Truth In Accounting, a nonpartisan think tank, the city has $184.6 billion in excess liabilities that its assets cannot cover, amounting to a $61,700 burden per taxpayer.
How do we know how much the city should fund these programs? Well, because the city, and plan providers more generally, tell would-be pensioners what they will pay them in exchange for their labor through a Defined Benefits plan system. The exact calculations for individuals are a bit complicated (and vary based on years worked, salary, seniority, department, life expectancy, etc.), but we can do some simple, illustrative math.
Let’s say Joan made $100,000 in her final year working for the city after 40 years of service. Based on when she joined the work force, she has a multiplier of 2%, which determines what percentage of her final average salary will be received as a retirement benefit. Based on these numbers, Joan is owed $80,000 per year.
$100,000 final salary x 40 years x 2% multiplier = $80,000 annual retirement benefit
Here’s where things get a little morbid. Underwriters expect Joan to live until she’s 85. If she retired at 62, they expect to pay her 23 years of retirement, totaling $1.84 million. Pretty easy so far.
To get the total pension obligation, we would multiply the average annual retirement benefit for all retirees like Joan, active workers, and vested former workers who aren’t receiving benefits yet. With a Total Pension Liability of $321.7 billion, each of the 798,000 workers in the city’s pension system are owed an average of $403,000. Retirees are owed far more, bringing up the average because their years of accrued work increase their annual owed benefit. For professions like Firefighters who can retire after 20 years, individuals may receive 40 or even 60 years of payments. More on this below.
[Coastal Cassandra saunters back in]
The city’s enormous unfunded retiree health care benefits, and the less daunting pension liabilities, rest on fairly dubious assumptions of how much they will have to pay out. I’m not confident they’ll be able to do so. The city, to their credit, will try until the very end, spending more and more on obligations, while services deteriorate further. This is not a hypothetical, but the inevitable answer to a math problem.
Discount Rate
The first part of the equation goes like this; pensions are undercounting how much they will have to fund because they’re relying on higher rates of return (discount rates) than they can realistically achieve. The city returned 10.3% in 2025, and has averaged 7.7% in annualized returns over the last 10 years.
It might seem rational—conservative, even—to set their expected rate of return at 7%. This is below the last decade’s average, after all. But the last few years have been among the strongest in the history of the stock market. Moreover, public pensions are advertised as risk-off for their beneficiaries. Based on their current investment holdings, this is not true. Two / Thirds of the pensions’ holdings are invested in equity positions that experience volatility, thus introducing risk to the advertised returns.
The closest thing we have to a risk-free return (which is not entirely without risk) is the 10-year treasury note, supported by the guarantee of the American Government. As of writing, it was yielding 4.25%. There are strong arguments that pensions should underwrite closer to this benchmark in order to ensure they can fully fund retirements for their beneficiaries if things go wrong. Most financial economists agree with this level, if not a lower one, given real long-run returns.
Something that isn’t up for discussion, however, is that every basis point increase in discount rates above the 10-year treasury definitionally adds risk. When New York’s pensions reduced their rates from 8% to 7%, it was a historically large reduction. But it still wasn’t enough. New York’s mayor at the time, Michael Bloomberg, knew a thing or two about finance. He commented “The actuary is supposedly going to lower the assumed reinvestment rate from an absolutely hysterical, laughable 8 percent to a totally indefensible 7 or 7.5 percent. If I can give you one piece of financial advice: If somebody offers you a guaranteed 7 percent on your money for the rest of your life, you take it and just make sure the guy’s name is not Madoff.” There’s not much more to say than this.
I don’t have anywhere near the knowledge to make a definitive claim on the matter, but based on reading the opinions of those who do, it seems 4-5% is a defensible number in today’s economic environment given the asset mix of pension funds. We’ll set it at 4.5%, knowing it might easily be 50 to 350 basis points lower.
At a 4.5% discount rate, as opposed to the present 7%, New York City’s Total Pension Liability increases to $425 billion, with unfunded liabilities of $130 billion. All it takes is a reversion to long term returns for this to happen, or just a few bad years in public and private markets. Better to plan for low returns and be surprised to the upside, than devastate thousands when high returns aren’t hit.
There’s one key element missing here, however. Every year, considerable amounts are withdrawn from the pension funds. Depending on how much is withdrawn, the returns required rise much higher to offset the diminution of the funds.
Withdrawals
$22 billion was withdrawn from the 5 major pensions in 2025. Distributed across 361,394 beneficiaries (2024) this amounts to ~$60,000 in withdrawals per beneficiary, per year—double the amount 20 years ago. Since 2000, more than $334 billion has been withdrawn from the major pension funds.3
This has been offset by high returns, and high contributions. In the same time period, the city and its employees contributed $318 billion in inflation adjusted terms ($242.5 billion nominally) for a roughly 85 / 15% split.4
But the funds are far smaller than they ought to be. At $321.7 billion, the present assets are only worth 1% more than the total amount of real contributions made since 2000. In that year, the total value of the five pensions (plus the few smaller subsidiaries the Comptroller includes in its reporting) was $136 billion. On that basis, the compound annual growth rate has been a paltry 3.5%. This is the real rate of growth after fees and withdrawals are factored out. Factor out contributions, and the fund is barely keeping afloat. Shouldn’t the Comptroller be underwriting to these returns, not twice as high?
If a more prudent distribution strategy were employed, would the pensions have greater security? As it happens, we have a pretty good counterfactual to the New York case. For the best financial minds, let’s head to Oslo.

Oil was discovered in the North Sea off the coast of Norway in 1969. 20 years later, the Norwegians created The Government Pension Fund Global to invest proceeds derived from the petroleum mining. The first money was put into the fund in 1996. Since then, around $540 billion dollars has been deposited (inflation adjusted). GPFG is now worth more than $2.2 trillion, or 4.07 times larger than the value of its cumulative investments. Part of this growth is due to the fact that the Fund is administered by world-class investors (Norges Bank Investment Management) who have consistently out-returned their peer group of large sovereign wealth funds. The Fund grew by 15.1% in 2025, exceptional for a vehicle this size.
The other reason, which I believe to be more important, is the Fund’s strong governance. Since 2001, the GPFG limited the amount that can be taken out per year. Initially set at 4%, withdrawals were limited to 3% of the Fund’s value in 2017. This is called the Fiscal Rule (Handlingsregelen). So long as the Fund delivers more than 3% a year, its value will grow in real terms, regardless of how large (or small) the contributions are.
This is critical. It means the central government cannot raid the fund for various causes, however noble. This allows compounding to continue unabated. The difference between 7% real fund growth after withdrawals and 6% over 30 years (with the same exact starting amount and annual contributions) is 16%. At a 4% CAGR, the difference is 61%, more than half the value of a fund. Just 300 basis points in difference per year can decay the great majority of a fund’s value.
Contrast Norway’s Fiscal Rule with the situation in New York, where annual fund returns and withdrawals are almost the same. In some years, withdrawals as a percentage of the fund have been greater than returns. So while the 7% yield anticipated by the Comptroller might sound good, it’s being outpaced by annual withdraws of 7.5% (the average withdrawal over the last decade). This imbalance has been covered up by ever growing contributions from the city and ahistorically high market returns. What happens when one of these conditions falters? How dire might things get when both are no longer true?
This more or less explains why the Norwegians manage ~800% more money than the New Yorkers, when the value of the contributions would assume this amount would only be 63% higher.
In other words, had New York’s pensions been managed as shrewdly as the Norwegians, they might have $1.4 trillion in assets—$1.1 trillion greater than they do today. This would more than cover any financial shortfalls discussed above. Such is the cost of fiscal imprudence.
More Retirees Than Workers
The forecast gets colder still. While the amount of active New Yorkers working for the city has stayed relatively consistent over the last 20 years, the number of beneficiaries has grown by more than 50%. In 2000, there were 105,234 more workers than beneficiaries. By 2024, this amount had dropped to less than 18,000.5
If present trends continue, there will soon be more people receiving benefits than contributing to the benefits pool. This will further burden the city, mandating the city spend successively more in contributions to support its pensioners, increasing the amount of absolute withdrawals per year. But that’s not all.
Back to Joan. What if, instead of passing away at 85 as the underwriters expect, she lives until 100? That’s another 15 years of $80,000 payments. What if, God willing, her friends all live well into their 90s as well, further inverting the gap between workers and beneficiaries?
To put an even finer point on the challenge here, let’s look to Joan’s son, John. John worked as a firefighter for 20 years in Queens, battling some of the borough’s most intense blazes. In thanks for his service, he’s owed $99,000 per year (the average for all FDNY retirees). Well earned at that. If John lives 50 more years, he’ll earn around $5,000,000 in total (without adjusting for inflation, meaning this amount will certainly be higher). And what’s more, he can take a new job after his service and still receive 6-figure payments from the city every year so long as he’s in the private sector, with no restrictions on how much he can make. Whether John should be able to do this is beyond the scope of this piece, but it inarguably furthers the liabilities the city will ultimately owe.
The city has made some efforts to fix this with its Tier 6 members, who must contribute a higher proportion of their working salary towards retirement, have to vest their payments over a longer period of time, and don’t receive full benefits until they turn 63. Though these are steps in the right direction, they will ultimately prove too little.
Without radical changes (which are politically unviable), New York is going to spend more and more on its obligations. And this is before credit downgrades and demographic inversions set in, which are both coming. A quarter of the budget is dedicated to Pensions and Debts, well more than double the amount 20 years ago.
If only we took a note from our Norwegian friends, who will be able to live off of the interest their interest has made so long as their prudent governance continues.
Fragility at the Peak of Prosperity Means…What, Exactly, When Things Go Wrong?
As I’ve attempted to stress throughout this piece, all these challenges have emerged while our major cities are doing extremely well—nominally, at least. Incomes have soared, hours worked are down, and tens of billions of dollars have been invested in improving the nonessential (though important) cultural and amenity offerings of superstar cities. But under the surface, things don’t feel right.
Tens of thousands of high paying jobs are fleeing blue cities for red states, following demographic outflows. Our largest cities are spending more for public services, but receiving less value. Two miles of New York’s Second Avenue Subway Extension (2017) cost around $5 billion—an order of magnitude greater per mile than recent extensions in Paris and Madrid. East Side Access, which connected the Long Island Rail Road’s main line from across the East River in Queens to Grand Central in Midtown East, cost $3.5 billion per mile. California’s High Speed Train catastrophe needs no further commentary.
As of 2017, per student spending had grown by more than 2.5x over the proceeding 40 years, with no change in test score outcomes. Over the last decade, costs have increased further still, and in our biggest cities and states, achievement levels have plummeted. Cost Disease has infiltrated both the public and private provision of services.
On the housing front, we’re paying considerably more, but the stock is getting worse. Median rents in Manhattan are now north of $5,000 a month, affordable only to households making more than $200,000 a year. Meanwhile, 39% of all renter-occupied units are in buildings constructed before World War II. Only 11% of apartments were constructed in the 21st century.
“Affordable” apartments and bathrooms that routinely cost more than a million dollars to construct, despite their modest size and spartan finishes, litter the land.
Tens of billions have been spent on efforts to reduce homelessness, all while the unhoused population booms. Cities now regularly spend more supporting homeless individuals than the median American household earns, which is 2.5 people large. We have $200,000 bus shelters which provide no shade and look like they were fabricated in a middle school shop class, all while people feel unsafe and frustrated on costly public transportation. (This is a case where the data doesn’t tell the full story —how many people report someone harassing them on Market Street in San Francisco, or while taking the Metro? Reported crimes likely only capture a fraction of the rate of incidence.)
As Noah Smith and Chris Arnade have convincingly written, we cannot live in cities without public order. It might seem kinder to bury our heads in the sand and pretend those playing music loudly on the subways or living in tent encampments are simply enjoying their proportionate right to the city as much as anyone else, but it is not true given the negative externalities. These slips in public order are the first cracks towards turnstile jumpers pushing innocents on the tracks, and encampments becoming open-air drug markets. When enough of these instances occur (and it doesn’t take many, as urbanism is predominantly a matter of perception), those who have the ability to leave, will. And those with the least means will be forced to bear the indiscretions of a public policy and criminal justice system that has consistently failed them.
Mercy to the guilty is cruelty to the innocent. And death for our cities.
If this is how poorly our cities are being governed with so much cash, what will they be like with less? And there will be less. People will leave if they don’t feel a city is being properly governed. If they feel unsafe. If the services degrade. If the rent is too high. If they feel, for all of their tax dollars, they aren’t benefitting from the sorts of things that cities far poorer than they’re supposed to be, are. And so they’ll leave. Taking their income, property, and sales taxes with them. Taking the vibrancy they offer to the streets, the funding they give to the schools, and the spending they shower across the city. This is not fear mongering, but weather forecasting a pattern that has been massing for some time.
When this happens, a doom loops set in. There’s less money to spend on cleaning the streets up, making sure the busses and trains run on time, keeping up the police force, staffing schools, and generally doing the sorts of things that make a city a pleasant place to spend time in. This forces more people out, which further reduces funding for services, which forces more people out, etc, etc. To see where this road leads, take a drive through the once prosperous lands of St. Louis, Detroit, Youngstown, Gary, Binghamton, or many dozens of others history has forgotten.
Those who remain are often those who cannot afford to move, which means they can’t fund the services. Lower income residents will, quite rationally, vote for more services as they cannot attain them individually. As more and more of the budget is dedicated to these safety net programs, less and less is allocated for core budget items like Transportation, Public Safety, Education, and Sanitation. And once that train goes downhill, there’s no stopping it.
Good Governance is a Math Problem.
Good Urbanism Is a Math Problem
Okay, great, thank you Coby, for lecturing us with thousands of words worth of municipal finance. What on Earth does this have to do with urbanism? Well my friends, in a word, everything. In two; absolutely everything.
When municipalities fail to maintain or govern themselves shrewdly, the project of urbanism collapses completely. How can we advocate for walkable, dynamic, and cosmopolitan lifestyles when the reality of what we’re promoting falls so dramatically short of our estimation of it? How does one get others to want to be a part of the project of building better cities if doing so might imperil their—or more importantly—their children’s lives? And for those who would nonetheless march forwards, how do we make it financially feasible? Whether from household affordability or municipal solvency perspectives?
If a city is spending a third of its budget on pensions and debt service, it cannot pay for protected bike lanes or new street plantings. If its tax base erodes through outmigration of its wealthiest earners, who will pay the salaries of bus drivers and teachers and street sweepers and elevator inspectors?
Cities are in competition with one another. They have unfortunately forgotten this, and assumed their present status is a permanent one. While San Francisco and New York may be desirable now, it wasn’t so long ago that public officials were getting assassinated in San Francisco’s city hall, and New York was bankrupt. We cannot afford to rest on our laurels, as the fall to a worse station is a short and brief trip. Le beau monde will then breathlessly move to some other city, or spend as much time as they can tolerate before heading to East Hampton, Aspen, Nantucket, Como, wherever, regarding New York as the new Detroit.
As with everything, we must do the unfashionable work of ministering to the core foundations of governance. Who would buy a new rug when the house they’re putting it in is crumbling down? For us to ensure the future project of North American urbanism, we must get well acquainted with the finances that underpin the structures of our cities, or all of the niceties of good urban design will rightly be seen as futile frivolities.
The next steps are extremely simple: build a lot of housing to broaden the middle of the tax base, reign in spending, and exercise prudence in the realm of long term debt and pension obligations. We must make some tough decisions, it’s true, or else this problem will get worse and worse. Getting people to accept less than they’re accustomed to is one of the more difficult challenges in governance, but it’s far better to have some agency over the course of austerity than it imposing itself on a city indiscriminately.
Remember, this is a math problem, not an ethical adjudication. We could argue over the merits of this or that social program’s funding ad infinitum. I have my ideas, but rather than step into that hornet’s nest, I’ll just note something drastic must be done, or else the cold front will freeze us all.
Good Urbanism, such as that which has transformed Paris over the last decade, requires numeracy. We can deny this at our peril, or embrace fiscal realities and create cities as wonderful as any the world has ever known. I know what I’m calculating.
[[divider]]
This article was originally published, in slightly different form, on Building Optimism. It is shared here with permission.
Coby Lefkowitz is a principal of Backyard, a real estate development and consulting firm focused on creating more beautiful, walkable, dynamic, and affordable communities. He is a leading writer within the worlds of urban planning and real estate development, and the author of the Best-Selling book “Building Optimism.” Coby is a professor of Real Estate Development at the Schack Institute of Real Estate at New York University.
%20(1).avif)
%20(1).avif)
%20(2).avif)
%20(1).avif)